Climate and Sustainability
Risk Management
General Insurance
Unaffordable and unavailable: the case for parametric home insurance



Claim your CPD points
Australia's home insurance affordability problem is thoroughly documented. Home premiums grew by an average of 7.2% per year between 2010 and 2025, while wages grew by 3.1% (APRA, 2026). The Australian Competition and Consumer Commission’s (ACCC) final monitoring report on the cyclone reinsurance pool found around half of households surveyed nationally rate their home insurance as unaffordable or barely affordable (ACCC, 2026). Using a stricter measure than self-assessment, the Actuaries Institute's Home Insurance Affordability Index put 1.61 million households, 15% of the country, in affordability stress in the year to March 2024, meaning premiums above four weeks of gross household income, with flood the dominant driver (Actuaries Institute, 2024). That reading predates the 2025 catastrophe year, so the true figure is almost certainly worse.
Theory has a clear answer to that pressure. Arrow (1963, 1971) and Raviv (1979) showed that when premiums are loaded proportionally to expected losses, the best contract a risk-averse buyer can hold is excess-of-loss: full cover above a deductible. In this context, a budget constraint on the premium simply requires an increase in the deductible. A premium can of course be reduced in other ways, by lowering the sum insured, dropping options, or fitting risk-reduction measures. But lowering the sum insured strips cover from the catastrophic end, which is the loss a household can least absorb, so the deductible is the lever the theory points at. Since claim sizes rarely reach the policy sum insured (Jung and Jung, 2025), the excess is the contract feature that matters. When policyholders choose higher excesses, the insurer sheds many of the smaller, more frequent claims. The risk that remains for the insurer then concentrates in two places: properties with severe catastrophe exposures, and financially constrained households. The financially constrained household channel is what this article focuses on.
No household insurer would write a $400,000 excess on a $500,000 home, though. Well before deductibles reach the levels the theory implies, insurers restrict terms, decline to quote, or withdraw. California shows how far that can run. In March 2024, State Farm General announced it would not renew about 30,000 homeowners, rental dwelling and other property policies in the state, and would leave the commercial apartment market altogether by not renewing all 42,000 of those policies, citing inflation, catastrophe exposure, reinsurance costs and the limits of decades-old regulation (State Farm General, 2024). Raising deductibles in high-risk areas is not just unattractive, it is unavailable.
The retreat in coverage is measurable. The Australian Prudential Regulation Authority’s (APRA) climate vulnerability assessment finds that under extreme stress test conditions, one household in four could be without home insurance by 2050, against roughly one in seven today, and above 40% in some rural areas (APRA, 2026). Cover is also thinning for those who keep it: 96% of Australian homeowners hold a policy, but only 59% believe it covers flood, and just 41% believe it would fund a complete rebuild and replacement of contents (CEDA, 2025). The problem is no longer mainly who holds a policy. It is what the policy can achieve. Is it time to consider other types of coverage, even if they are not comprehensive, such as parametric?
The very mechanism of a deductible is problematic. Indemnity with a large excess is last-dollar protection: it engages only once losses clear the retained layer, which households are least likely to reach and least able to fund. A vanilla parametric cover, on the other hand, is first-dollar protection, a fixed sum paid whenever a defined event is triggered, whatever the damage. Scaling parametric cover down buys a smaller payment that still arrives immediately; scaling indemnity down removes cover from the losses that actually happen; see Figure 1, calibrated to a $500,000 home in a flood zone (the “full budget” is for a theoretically optimal indemnity cover).
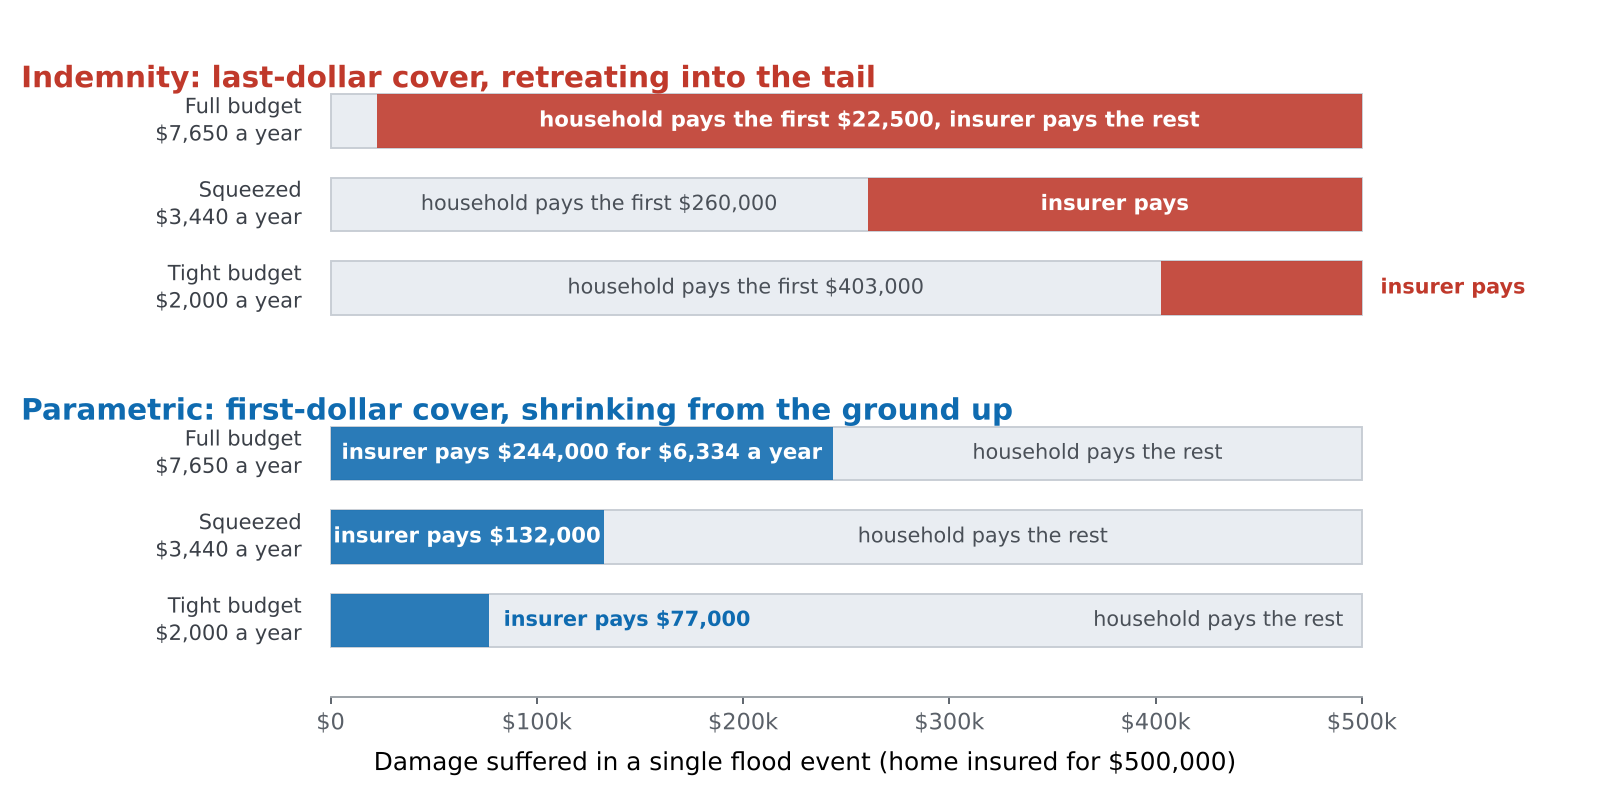
Figure 1: Scaling cover down to fit a premium budget (not necessarily spent in full). Indemnity can only become affordable by pushing the excess further into the tail, which is last-dollar protection; parametric shrinks a first-dollar layer. No insurer sells the deductibles displayed above. Illustrative values from the model described below, calibrated to a $500,000 home in a flood zone. Source: Avanzi, Falden & Steffensen (2026).
In a recent paper with co-authors Debbie Kusch Falden and Mogens Steffensen, published (open access) in the Journal of Risk and Insurance, we revisit the classical result with parametric cover brought into the comparison (Avanzi, Falden & Steffensen, 2026). Today, parametric household cover is not something most buyers can simply choose. It exists in some markets but remains very undeveloped at the household level. The question is whether the theory says such cover should exist.
We compare an excess-of-loss contract with a parametric contract paying a fixed sum per event, under a single mean-variance objective and with no difference in risk attitude between them; the loss model and derivations are in the paper. Each premium adds two costs to expected claims, and the contracts may differ in both. The loading is the cost of capital: indemnity likely needs more, because it carries the right tail of severity, while a parametric payout never depends on severity. The added fixed cost for the indemnity coverage is what it takes to settle a claim: loss assessment, the post-disaster demand surge that inflates repair costs. The parametric cover does not have to cover those extra costs (Cummins & Mahul, 2012).
We vary the loadings, the fixed costs and the household's premium budget, and at each combination see which contract wins. The indemnity contract is allowed any deductible the household likes, including levels no insurer would write. The mechanism separating indemnity and parametric payouts is that they start from opposite ends of the same loss distribution. Cutting the parametric payment shrinks a layer that still pays on every event, while raising the deductible withdraws cover from the losses that happen most often (Figure 2).
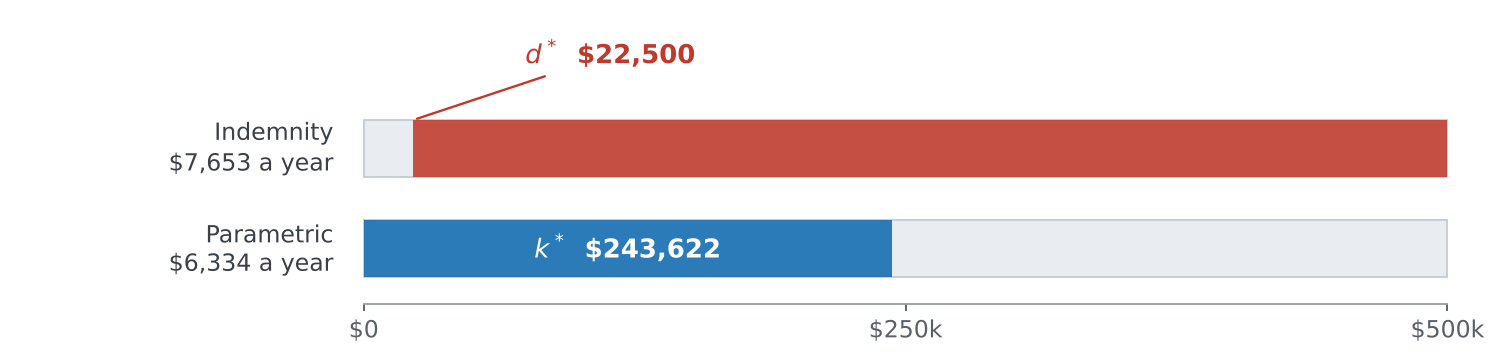
Figure 2: What each contract covers. The bar spans the damage from a single event, from $0 to the $500,000 sum insured. Indemnity (top) pays everything above the deductible d*, so the household bears the first $22,500. Parametric (bottom) pays a fixed sum k* of $243,622 whenever the trigger is met, whatever the damage. Each contract is shown at its optimum, with its annual premium on the left. Source: Avanzi, Falden & Steffensen (2026).
Consider a $500,000 home on a flood plain with a one-in-50-year chance of severe flooding (to fix ideas, the gauge in the Ipswich CBD was sitting at that level in 2011; see Queensland Reconstruction Authority, 2019). Expected damage given an event is $266,000, with a 24% chance of a complete write-off. Going uninsured on that property costs about $19,000 a year in certainty equivalent (welfare loss). With indemnity fixed costs of $1,000 a year and a 30% loading on both products, the results are stark.
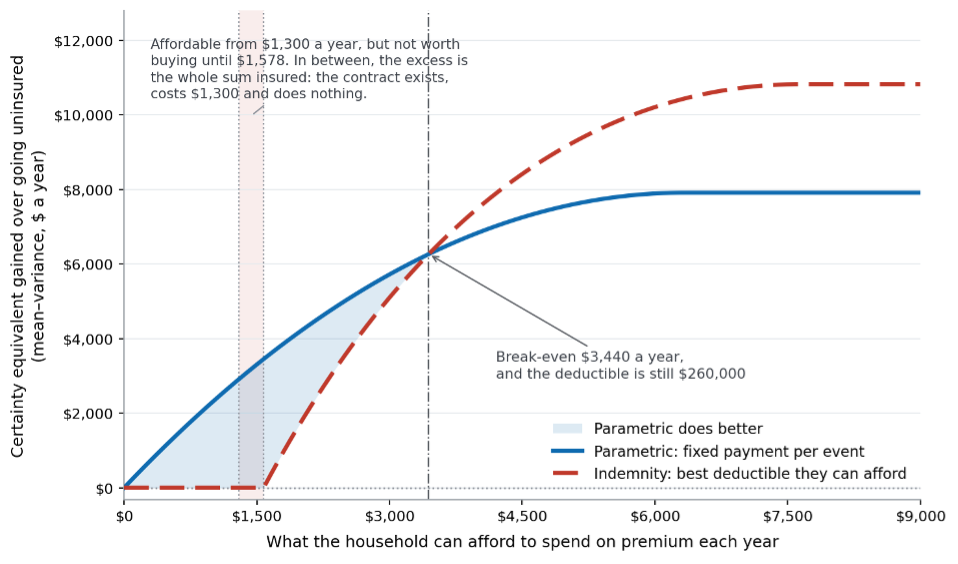
Figure 3: Certainty equivalent gained over going uninsured, by annual premium budget. Indemnity is affordable from $1,300 a year but not worth buying until $1,578; parametric dominates while the budget is tight, and indemnity takes over above $3,440. Source: Avanzi, Falden & Steffensen (2026).
Take this from the perspective of the household budget for a premium. Below $1,300 a year, even our idealised indemnity contract is infeasible: the fixed costs alone exceed the budget. At exactly $1,300, the only deductible the budget can pay for is the whole sum insured, so the contract exists, costs $1,300 and buys nothing. Up to $1,578 it is affordable but still not worth having, because the deductibles within reach are so high that the sliver of cover they buy is worth less than the premium charged for it. At $2,000, the household will buy, but only at a $403,000 excess on a $500,000 home, a contract no insurer sells. The same $2,000 buys $77,000 of parametric cover payable from the first dollar of any event, and delivers more than twice the (welfare) gain. The two break even at about $3,440 a year, where the notional deductible is still around $260,000. Above that, indemnity pulls away, and once the budget is no longer a constraint, it wins comfortably.
The shape of the result is a key point. The parametric advantage is non-monotonic: it appears at low budgets, narrows as indemnity becomes genuinely useful, and vanishes once neither product is constrained. That is, parametric insurance is not better insurance. Rather, it wins in exactly the region where indemnity provides little value, and it does so even when we pretend indemnity is available on terms it never is (i.e., large deductibles). Relax that pretence and the parametric region only widens.
The budget constraint is what drives this, not (as much) the cost difference between the two products. Set budgets aside and ask instead how much dearer indemnity would have to be before parametric won outright, and the answer is a fixed cost of $3,239 a year on top of expected claims, roughly half the indemnity premium. This would cover the additional costs related to indemnity covers such as per-policy loss adjustment or post disaster super-imposed inflation, and the cost of settling slowly. On their own, those frictions are a demanding (although not outlandish) route to the result.
The loading is the other wedge, and a far less demanding one. Hold the parametric loading at 30% and ask how far the indemnity loading would have to rise instead: parametric wins outright once it reaches 129%, which corresponds to a loss ratio of 44%. Interestingly, Jung and Jung (2025) report that the median ratio of expected loss to premium is 28%, which implies a loading nearer 260%. This suggests our indifference threshold may not be unrealistic.
That region where parametric insurance is optimal is not hypothetical here, and public policy has so far reached only part of it. The cyclone reinsurance pool has worked broadly as intended: on the ACCC’s renewal-based monitoring, home premiums in higher cyclone-risk areas fell 14% in the two years after insurers joined, against increases elsewhere (ACCC, 2026), and on the Australian Reinsurance Pool Corporation’s (ARPC) standardised new-business quotes, a different measure, the cumulative fall since October 2022 is about 37% (ARPC, 2026). But the largest reductions accrue to households at greatest cyclone risk, 2% of policies nationally, and standalone flood sits outside the pool entirely.
Flood is where the failure concentrates, and where it falls least evenly: of the 242,000 dwellings assessed at severe-to-extreme flood risk, about 77% carry no flood cover, and 70% of the 242,000 are in areas with below-median incomes (Insurance Council of Australia, 2025). Household parametric cover does exist here, if barely: Redicova (2026) sells alongside home, strata, business and farm policies, paying a fixed sum within three business days when the Bureau of Meteorology declares a category three or stronger cyclone over the insured address. The insurance review commissioned for Lismore after the 2022 floods went further, proposing a portfolio of instruments at national, community and individual levels, and arriving at our conclusion from the practitioner side: parametric products are not necessarily cheaper than indemnity insurance, but they can be more affordable, because a household can buy a smaller one (Jarzabkowski, Meissner & Mason, 2024).
We do not claim parametric to be a miracle solution either. Basis risk is real: a homeowner may suffer damage but receive no payout because the trigger is not met, or the payout may not match the loss suffered. Catastrophe triggers are systemic, since one cyclone triggers every policy in its footprint, so thin markets diversify less well than indemnity and may require higher loadings if too concentrated (in other words, the assumption that parametric cover needs a smaller loading because there is no severity risk may be invalid). Parametric contracts also still sit awkwardly between insurance and derivatives for regulatory and accounting purposes (BIS Financial Stability Institute, 2024). Against all of that, parametric carries no moral hazard by construction, since no household influences whether a flood arrives, and Jung and Jung (2025) put the cost of moral hazard under indemnity at about $7 a policy, or 0.7% of the risk premium.
Programs that rebuild the home rather than paying cash carry a further benefit: they help homeowners understand their risk, put practical measures in place, and get back on their feet sooner. Queensland’s $741 million Resilient Homes Fund (Queensland Reconstruction Authority, 2022) did all three, according to the evaluation I worked on (Jarzabkowski et al., 2026), and New South Wales runs a comparable $880 million program (NSW Reconstruction Authority, 2026).
Parametric cover has resilience potential, but not in its vanilla form. The loss adjuster's visit is the institutional moment at which resilience measures get specified, surveyed and paid for: Flood Re reimburses up to £10,000 of resilience work on top of like-for-like repair (Flood Re, 2022), and Suncorp's Build it Back Better offers up to $15,000 here (Suncorp, 2025). A parametric payment has no equivalent moment. The cash is flexible and does not require like-for-like reconstruction, but it is undirected. This is absent in our model: we penalise the indemnity cover for the cost of loss assessment, but do not penalise the parametric cover for its absence.
In Australia, the imbalance between reactive and prospective funding is severe. Of $15.9 billion of Commonwealth-administered disaster funding between 2018-19 and 2022-23, recovery alone took $13.9 billion; with response, the post-event side comes to $14.8 billion, or 93%. Risk reduction and resilience together took $1.0 billion, 7%, with preparedness and prevention accounting for the remaining $0.1 billion (Colvin, 2024, Figure 4). The categories are not loose: the Glasser Review (Glasser, 2023) had Commonwealth policy adopt the UNDRR taxonomy, under which that 7% is prospective plus corrective risk management and the 93% compensatory plus reactive. Parametric cover is compensatory by construction. Shifting household protection toward it without rebuilding the resilience hook would not, by itself, correct the imbalance.
The design implication follows. Indemnity and parametric covers are complements, not substitutes: one approach could be a parametric liquidity layer that pays quickly and stays affordable, sitting under a smaller indemnity layer that covers larger losses and provides claims assessment and recovery support. That is a product development question for insurers; a capital and disclosure question for regulators, whose frameworks may implicitly privilege indemnity; and a data question for government or industry groups, since better hazard data and transparent triggers shrink basis risk.
Some of that work now has a home. From January 2027, the University of Melbourne's Faculty of Business and Economics funds BRACE: Financing Disaster Resilience and Adaptation, a five-year research laboratory I lead with Ben Neville (co-director of the University of Melbourne Climate Futures), spanning actuarial science, finance, mathematics, engineering, climate and hazard science and management across multiple countries, with an Industry Advisory Board chaired by Sharanjit Paddam. Its premise is where this article arrives at: the centre of gravity has to move from transferring disaster risk to reducing it, and to financing efficiently the risk that remains. Pricing hybrid structures, and the residual risk beneath them, fits squarely within that work.
Above all, it reframes the policy question. Affordability work that asks only how to keep indemnity premiums down may be answering the wrong question. Where insurance is genuinely failing, the choice is not between good cover and cheap cover. It is between a smart, albeit partial cover, and none.
References
ACCC (2026). Insurance Monitoring Report 2026. Canberra: Australian Competition and Consumer Commission. https://www.accc.gov.au/about-us/publications/serial-publications/insurance-monitoring-reports/accc-insurance-monitoring-report-2026
Actuaries Institute (2024). Home Insurance Affordability and Home Loans at Risk. Sydney: Actuaries Institute. https://www.actuaries.asn.au/research-analysis/thought-leadership/home-insurance-affordability-and-home-loans-at-risk
APRA (2026). Mind the Gap: An Insurance Climate Vulnerability Assessment. Sydney: Australian Prudential Regulation Authority. https://www.apra.gov.au/news-and-publications/mind-gap-insurance-climate-vulnerability-assessment
ARPC (2026). Cyclone Reinsurance Pool Premium Assessment, May 2026. Canberra: Australian Reinsurance Pool Corporation. https://arpc.gov.au/wp-content/uploads/2026/05/ARPC-Cyclone-pool-premium-assessment-May-2026.pdf
Arrow, K. J. (1963). Uncertainty and the welfare economics of medical care. American Economic Review, 53(5), 941–973.
Arrow, K. J. (1971). Essays in the Theory of Risk-Bearing. Amsterdam: North-Holland.
Avanzi, B., Falden, D. K., & Steffensen, M. (2026). When indemnity insurance fails: parametric coverage under binding budget and risk constraints. Journal of Risk and Insurance (open access). https://doi.org/10.1111/jori.70070
BIS Financial Stability Institute (2024). Uncertain Waters: Can Parametric Insurance Help Bridge NatCat Protection Gaps? FSI Insights on Policy Implementation No. 62. Basel: Bank for International Settlements. https://www.bis.org/fsi/publ/insights62.pdf
CEDA (2025). In the Dark: Australians Need to Know Their Disaster Risk. Data Insight, by L. Dillon. Melbourne: Committee for Economic Development of Australia. Analysis of HILDA Survey Release 23. https://www.ceda.com.au/research-and-policy/research/climate-environment-emissions-reduction/in-the-dark-australians-need-to-know-their-disaster-risk
Colvin, A. (2024). Independent Review of Commonwealth Disaster Funding: Final Report. Canberra: National Emergency Management Agency. Figure 4 (p. 66) splits Commonwealth administered disaster funding across the disaster continuum, 2018-19 to 2022-23. The 7% risk reduction and resilience share, usually cited to the review’s interim report via Glasser (2023), is the sum of that figure’s risk reduction (4%) and resilience (3%) lines. https://www.nema.gov.au/about-us/governance-and-reporting/reviews/independent-review-of-commonwealth-disaster-funding
Cummins, J. D., & Mahul, O. (2012). Catastrophe Risk Financing in Developing Countries. Washington DC: World Bank.
Flood Re (2022). Build Back Better. London: Flood Re. https://www.floodre.co.uk/buildbackbetter/
Glasser, R. (2023). Independent Review of National Natural Disaster Governance Arrangements: Final Report. Canberra: National Emergency Management Agency. https://www.nema.gov.au/sites/default/files/2025-05/20240813%20-%20Glasser%20Review%20-%20Final%20Report_copy%20edit.pdf
Insurance Council of Australia (2025). Insurance Catastrophe Resilience Report 2024–25. Sydney: Insurance Council of Australia. https://insurancecouncil.com.au/wp-content/uploads/2025/10/21340_ICA_CAT-Report_2025_Final-spreads.pdf
Jarzabkowski, P., Meissner, K., & Mason, M. (2024). Insurance Status Review and Recommendations for Lismore. Northern Rivers Adaptation Division, NSW Reconstruction Authority.
Jarzabkowski, P., Riordan, T., Gallagher, R., Pham, W. L. D. Q., Avanzi, B., Mason, M., Rambaldi, A., Zahnow, R., Johnson, L., Wyeth, S., Deng, R., Taylor, N., & Xie, Y. (2026). Evaluation of the Resilient Homes Fund: Final Report. Report No. 70.2026. Melbourne: Natural Hazards Research Australia. ISBN 978-1-923057-53-1. https://www.naturalhazards.com.au/sites/default/files/2026-06/T4-A6a_Final%20Report_Evaluation%20of%20the%20RHF_20260605.pdf
Jung, H., & Jung, J. (2025). Economics of property insurance. Federal Reserve Bank of New York Staff Reports, no. 1171. https://doi.org/10.59576/sr.1171
NSW Reconstruction Authority (2026). Resilient Homes Program. Sydney: NSW Reconstruction Authority. https://www.nsw.gov.au/departments-and-agencies/nsw-reconstruction-authority/about-us/reconstruction/resilient-homes-program
Queensland Reconstruction Authority (2019). Brisbane River Strategic Floodplain Management Plan. Brisbane: State of Queensland. https://www.qra.qld.gov.au/brcfs/brisbane-river-strategic-floodplain-management-plan
Queensland Reconstruction Authority (2022). Resilient Homes Fund. Brisbane: State of Queensland. Jointly funded by the Queensland and Australian Governments under DRFA Category D. https://www.qra.qld.gov.au/resilient-homes-fund
Raviv, A. (1979). The design of an optimal insurance policy. American Economic Review, 69(1), 84–96.
Redicova (2026). Fast cyclone cash insurance. https://redicova.com.au/
State Farm General (2024). Update on California. Bloomington IL: State Farm. Announcement of 20 March 2024. https://newsroom.statefarm.com/update-on-california/
Suncorp Insurance (2025). Build it Back Better. https://www.suncorp.com.au/insurance/home/build-it-back-better.html
The views expressed in this article are those of the author(s) or working group named below, and do not necessarily reflect the views of the Actuaries Institute. This work is licensed under a Creative Commons Attribution-NonCommercial-No Derivatives CC BY-NC-ND Version 4.0.

From physical risk modelling to transition pathways, explore our latest thinking on climate and sustainability
Subscribe to Actuaries Digital for free and receive the latest actuarial analysis, research, and commentary direct to your inbox