Climate and Sustainability
Actuarial careers
Industry topics
Upcoming events
The Institute
Our community

Claim your CPD points
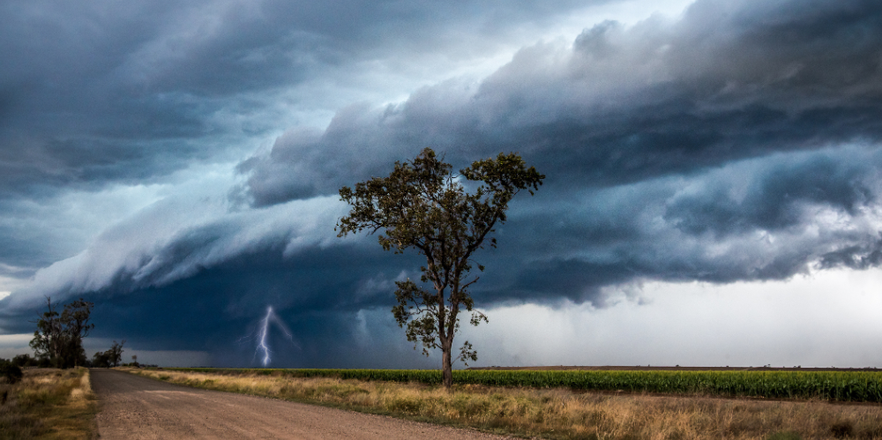
The Australian Actuaries Climate Index (AACI) recorded its 42nd consecutive positive value in the summer of 2025/26, indicating that the frequency of extreme weather across Australia continued to remain above the 1981–2010 reference period average.
The composite index, which combines high temperature, rainfall, wind and sea level, showed positive values across all regions, reflecting a mix of regional extremes. Contrary to the spring of 2025 , the southern parts of the country experienced unusually high temperatures, while the north remained wetter than average.
The extreme high temperature index was elevated across most of New South Wales, Victoria and South Australia during summer.
A key contributor was the January 2026 heatwaves. In late January 2026, south-east Australia experienced a significant heatwave, with temperatures approaching 50°C in some locations [1] . Temperatures were up to 21°C above average and persisted for approximately a week.
While this event led to historic maximum temperatures being recorded in towns across South Australia, Victoria and New South Wales, the extreme high temperature index did not reach record levels. The highest index values were seen in Rangelands South Australia, and Arid Inland New South Wales, which both recorded the sixth highest value on record. For both regions, this represents the highest value since the 2019-20 Black Summer heatwaves. Coastal South Australia, New South Wales and Victoria all recorded more moderate elevations.
This apparent disconnect between record-breaking temperatures and only moderate index values reflects the construction of the index. First, the index is aggregated across a three-month period and a broad geographical area, meaning extreme conditions must be both sustained and widespread to produce record values.
Second, the index measures the frequency of extreme temperatures rather than their severity. Once temperatures exceed the defined threshold, further increases do not contribute additional weight to the final value.
As a result, prolonged and geographically widespread events such as the Black Summer heatwaves and the 2009 southeastern Australia heatwave rank as more extreme in the index than shorter, more intense events like January 2026.
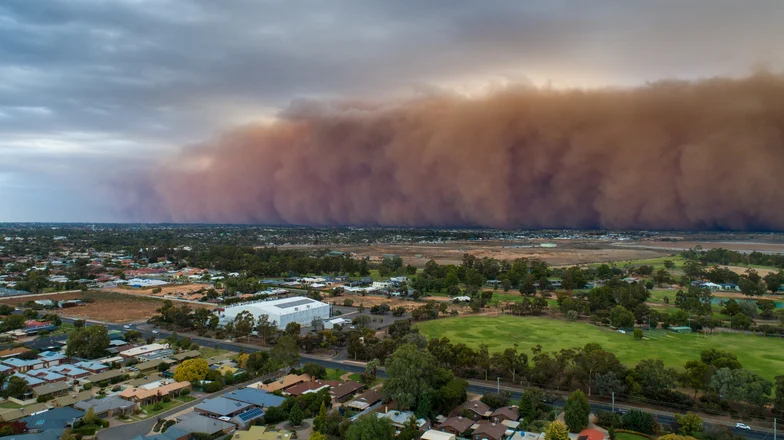
Despite not reaching record levels in the index, the elevated temperatures still had significant impacts on the ground. The elevated temperatures contributed to conditions that enabled bushfires to tear through parts of Victoria, South Australia and New South Wales. Notably, Victorian bushfires destroyed more than 700 structures, at least 300 homes and burnt over 400,000 hectares of land in early January 2026 [2] . The event was declared a catastrophe by the Insurance Council of Australia (ICA), and over $400m in insurance claims have been reported to date [3] .
In contrast, parts of Queensland, the Northern Territory and Western Australia recorded negative extreme high temperature values, indicating that the frequency of extreme high temperature events was below the long-term average. This highlights the regional variability in conditions during the season.
The extreme rainfall index was positive across most of Australia in summer 2025/26. However, parts of southern Australia recorded negative values, shown in the map below.
Elevated extreme rainfall index values were primarily concentrated in Queensland and the Northern Territory. The Monsoon Northeast region, located in the north of Queensland bordering the Gulf of Carpentaria, recorded its third highest extreme rainfall index value.
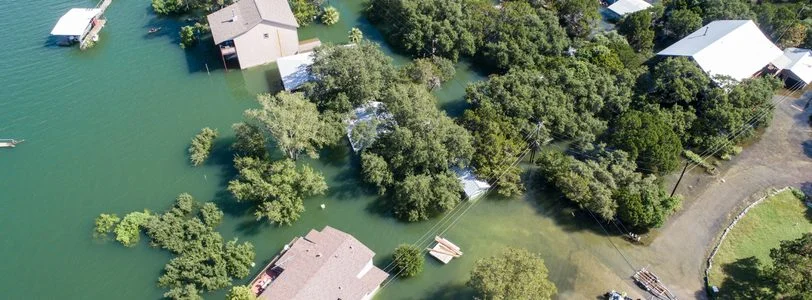
These positive values were driven by a range of tropical systems that brought widespread heavy rainfall and flooding to parts of northern and central Australia [4] . Tropical lows and low-pressure troughs typically generate heavy rainfall and thunderstorms by drawing in warm, moist air, which promotes cloud formation and precipitation.
A notable example was Tropical Cyclone Koji, which made landfall near the Whitsundays on 11 January and brought extensive rainfall, with some catchments observing more than 350mm of rainfall within 24 hours [5] .
These extreme rainfall events were consistent with the current La Niña phase of the El Niño-Southern Oscillation (ENSO) weather system, which tends to increase rainfall across eastern Australia.
The sea level index remained elevated across Australia throughout summer, continuing the broader pattern highlighted in the recent v2.0 release of the Australian Actuaries Climate Index .
The Monsoonal Northeast region recorded its highest ever sea level index value. Surrounding regions also observed elevated sea level index results.
These increases are likely linked to the tropical lows and low-pressure troughs impacting northern Australia. Lower atmospheric pressure, storm surge and larger waves can all raise sea levels [6] . Warm sea surface temperatures, which were ranked tenth highest in the Australian region and third highest globally in February, also play a role through thermal expansion [7] .
Since the end of the summer season, northern and northeastern Australia have experienced significant flooding brought on by ongoing severe rainfall [8] . The 2025/26 La Niña phase is now approaching its conclusion, which may lead to reduced rainfall on the east coast. However, transitions away from La Niña can increase sea surface temperatures, which in turn can enhance moisture availability and energy in the atmosphere, potentially intensifying storms and cyclones [9] .
The Bureau of Meteorology notes that a shift toward El Niño is possible by the end of winter 2026, though some uncertainty remains [10] . The National Oceanic and Atmospheric Administration’s Climate Prediction Centre suggests that El Niño is likely to emerge between June and August and persist through the remainder of the year, bringing warmer, drier conditions to eastern Australia and reducing winter and spring rainfall [11] .
Meanwhile, the Southern Annular Mode (SAM) has transitioned to a neutral state and is expected to remain so until at least April. Combined, these factors contribute to a long-range forecast for April to June 2026 of below-average rainfall and warmer-than-average daytime temperatures [12] .
The Index measures the frequency of extreme weather conditions and sea levels across Australia and how these vary over time. Components cover extreme high and low temperatures, extreme rainfall, consecutive dry days (as an indicator of drought), extreme wind and sea level. The Index was first launched in November 2018 by the Actuaries Institute and version 2.0, which includes enhancements not available at the time of the original Index, was released in 2025. It is updated four times a year by Finity Consulting for the Actuaries Institute.
Unlike many other measures, the AACI focuses on changes in the extremes. This is a more relevant metric for the insurance industry (and others) than averages, as it correlates more closely with damage. This is done by measuring how often we observe the current quarter’s observations exceeding the 99th percentile of the corresponding observations in the reference period of 1981-2010. More details and full results can be found on the website .
The purpose of the AACI is to provide a publicly available and objective measure of extreme weather conditions and sea level and is one way in which the actuarial profession can contribute to the assessment of climate risk. The AACI has been referenced extensively in the media and other reports [13] .
Alongside the North American Actuaries Climate Index [14] , it is one of two climate indices which have been produced globally for several years on behalf of actuarial associations. Several other actuarial associations, including Columbia, Singapore and the Caribbean, have or are in the process of launching similar indices.
[1] https://www.abc.net.au/news/2026-01-26/south-east-australia-weather-hit-close-to-50c-worst-heatwave/106270302
[2] https://www.abc.net.au/news/2026-01-14/victorian-bushfires-january-14-singapore/106226522
[3] https://insurancecouncil.com.au/news-hub/current-catastrophes/catastrophe-261-victoria-bushfires/
[4] https://www.bom.gov.au/climate/current/season/aus/summary.shtml
[5] https://www.bom.gov.au/cyclone/history/Koji_2026.shtml
[6] https://www.cmar.csiro.au/sealevel/sl_drives_short.html
[7] https://www.bom.gov.au/climate/ahead/outlooks/
[8] https://www.theguardian.com/australia-news/2026/mar/12/northern-australia-floods-bundaberg-katherine-queensland
[9] https://www.bom.gov.au/climate/enso/?ninoIndex=nino3.4&index=rnino34&period=weekly
[10] https://www.bom.gov.au/climate/enso/?ninoIndex=nino3.4&index=rnino34&period=weekly
[11] https://www.cpc.ncep.noaa.gov/products/analysis_monitoring/lanina/enso_evolution-status-fcsts-web.pdf
[12] https://www.bom.gov.au/climate/ahead/outlooks/archive/20260312-outlook.shtml
[13] For example, https://naturaldisaster.royalcommission.gov.au/publications/exhibit-1-006003-shp5010010001-australian-actuaries-climate-index-some-comments-extremes
[14] https://actuariesclimateindex.org/home/
This work is licensed under a Creative Commons Attribution-NonCommercial-No Derivatives CC BY-NC-ND Version 4.0.
Explore the data, methodology and what the trends mean for risk
Subscribe to Actuaries Digital for free and receive the latest actuarial analysis, research, and commentary direct to your inbox