Superannuation and Investments
Investment sequencing risk is a real danger



Claim your CPD points
Many believe the greatest risk, when planning retirement incomes, is longevity risk. Longevity risk is important but outweighed by health risks and investment sequencing risk. Allocating a total score of 10 across all retirement planning risks gives a distribution of these scores something like:
| SCORE | RISK |
| 3 | Investment sequencing risk |
| 3 | Health risks |
| 2 | Longevity risk |
| 1 | Poor investment performance (compared to benchmarks) |
| 1 | Other (including ignorance) |
| 10 | |
Sequencing risk is the risk that your accumulated superannuation savings receive the worst returns at the worst possible time – the years around your retirement and, in particular, the years just after retirement when account balances are highest and cash flow is usually negative. Investment returns can vary widely from year-to-year and the timing of this volatility, and your chosen asset allocation, can make significant differences to how much you get to enjoy your retirement.
Many financial planners and retirement income experts and commentators suggest that an optimum retirement strategy should be based on a combination of:
(a) an account-based pension; and
(b) a lifetime investment-linked insured annuity; or
(c) a lifetime "group self annuity” (GSA); or
(d) a guaranteed lifetime or term annuity; and, if applicable
(e) the means-tested Government-provided Age Pension.
However, a concern for many is that (a), (b) and (c) are subject to sequencing risk. Also, the cost of sequencing risk is built into the price of (d). Fortunately, the Age Pension provides some offset for part pensioners. The question we will now examine is, how do these sequencing risks vary by asset allocation?
Recent research Sequencing Risk and Asset Allocation on this topic was presented at the 2026 All Actuaries Summit in Melbourne.
A straightforward and effective starting point to gauge relative sequencing risk is to measure the fall in the relevant unit price of an asset allocation. In the above research, this is referred to as “cumulative decline”. The fall in unit prices quantifies the cumulative decline between any two dates. The following analysis also uses this approach. It is based on Australian data for the 67 years ending 30 June 2026. The analysis does not allow for cash flow (such as account-based pension drawdowns). Nevertheless, the number and average of cumulative declines are realistic and reasonable indicators of relative sequencing risk outcomes for comparisons of different asset allocations. Since these declines result from negative investment returns, the "average cumulative declines" are recorded below with a negative sign.
The tables below use the Austmod historical investment performance data described in Sections 3 and 4 of Australian Investment Performance 1959 to 2022 (and Investment Assumptions for Stochastic Models) presented to the 2023 International Congress of Actuaries (ICA) in Sydney. This data is similar to the Australian Prudential Regulation Authority (APRA) Heatmap benchmarks but extends back to 30 June 1959 at quarterly intervals. The tables include a typical “Balanced” portfolio with 70% growth assets (including 29% in diversified international shares) and a typical “Capital Stable” portfolio with 30% growth assets. All results are before investment tax, after approximate imputation credits (for the full period) and after investment fees, and therefore should be reasonably realistic for pension and annuity products.
The tables are ranked from the lowest to the highest sequencing risk within two investment allocation groups, loosely described, respectively, as "Growth" and "Defensive".
For a “sequence”, page five of the research paper suggests a focus on declines over three years or longer. On this basis, the number of cumulative declines in the 67 years to 30 June 2026 over three years or longer is quantified in each table. This value, at least approximately, captures the overall sequencing risk for each asset allocation in one figure.
A retiree or annuitant who is highly averse to sequencing risk might wish to also recognise declines earlier than three years. However, this only impacts the rankings of one asset allocation within each group. In the "Growth" group, the ranking for “Balanced” improves to marginally better than Australian Shares. In the "Defensive" group the ranking for Australian Government Semis zero to three years improves from third to first.
The Average Cumulative Declines fluctuate almost randomly from year-to-year, so for brevity the tables only record every second year.
The average 67-year annual returns might not appear to vary much between different asset allocations. But over long periods the apparently small differences can have a significant impact. For example, a single investment of $10,000 will grow to about $28,400 over ten years if invested at 11% p.a., whereas it will grow to only $19,700 if invested at 7% p.a. Over 20 years, the single investment will grow to $80,600 at 11% p.a., compared to only $38,700 at 7% p.a.
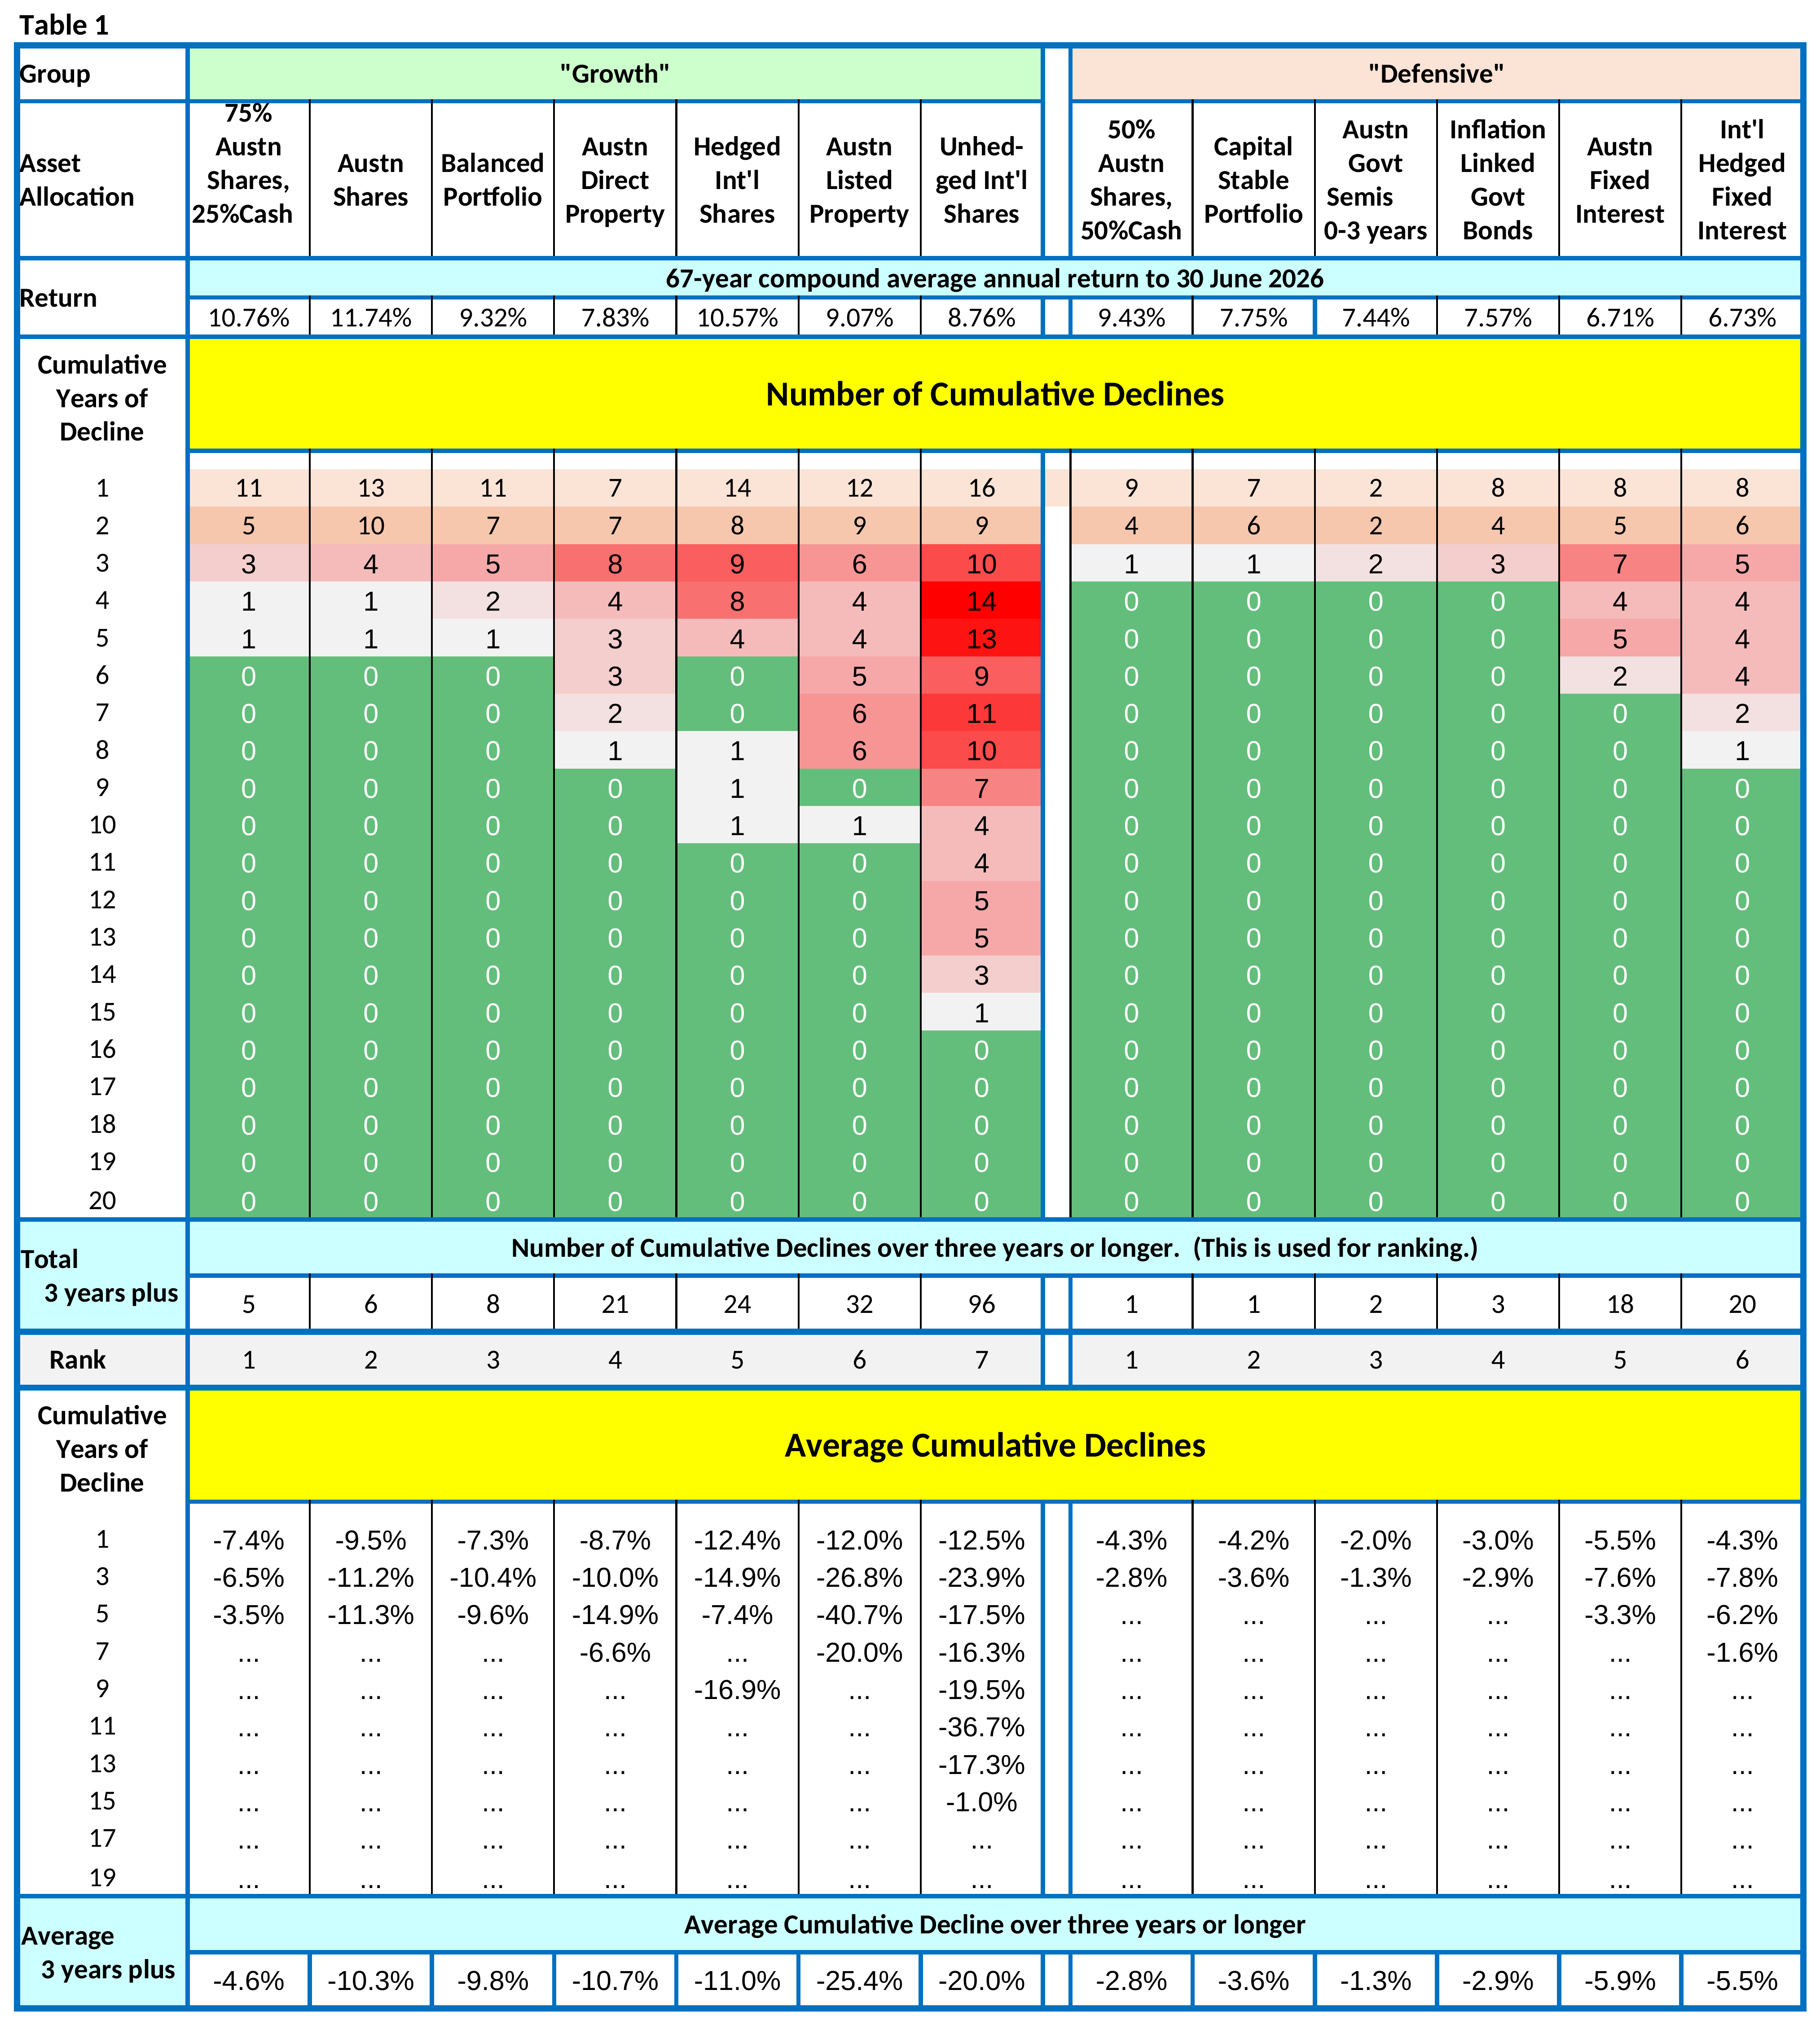
Table 1: Nominal Sequencing Risk
Based on the historical data, the probability of these declines occurring can be determined from the formula:
(Probability of a cumulative decline of n years) = (number of n-year occurrences) / (68 - n)
For example, for Australian Shares the probability of a cumulative decline of three years is 4/ (68-3) =6.2%. Also, for Australian Fixed Interest, the probability of cumulative declines over three years or longer is approximately 18/ (68-4.1) = 28%, based on 4.1 years being the weighted average of the cumulative declines over three to six years.
In Table 1, the number of cumulative declines for Unhedged International Shares is notably high. The reaction from many would be that the 96 declines over three years or longer is surprising.
In Table 1, the number of cumulative declines for Unhedged International Shares is notably high. The reaction from many would be that the 96 declines over three years or longer is surprising.
The extreme 15-years' decline occurred from 30 June 1998 to 30 June 2013. Further explanation of all 96 cumulative declines is analysed below:
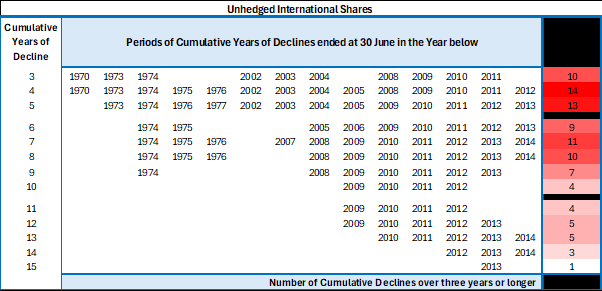
Unhedged International Shares
Table 2 below is similar to Table 1 above, but the results are presented for ‘real’ sequencing risk, allowing for price inflation. As a consequence, the real cumulative declines for six of the asset allocations now extend beyond 20 years, so the table extends to 30 years. Table 2 is ranked from the lowest to the highest real sequencing risk within the two investment allocation groups.
Due to the change to a real basis, the rankings within both the "Growth" and "Defensive" groups are different to those in Table 1. Direct Property and Listed Property have better rankings on a real basis than on a nominal basis. Also, for the "Defensive " group, the ranking of Capital Stable has fallen and the rankings for Inflation-linked Government bonds, Australian Government Semis zero to three years and International Hedged Fixed Interest have each improved by one rank.
In Table 2 below:
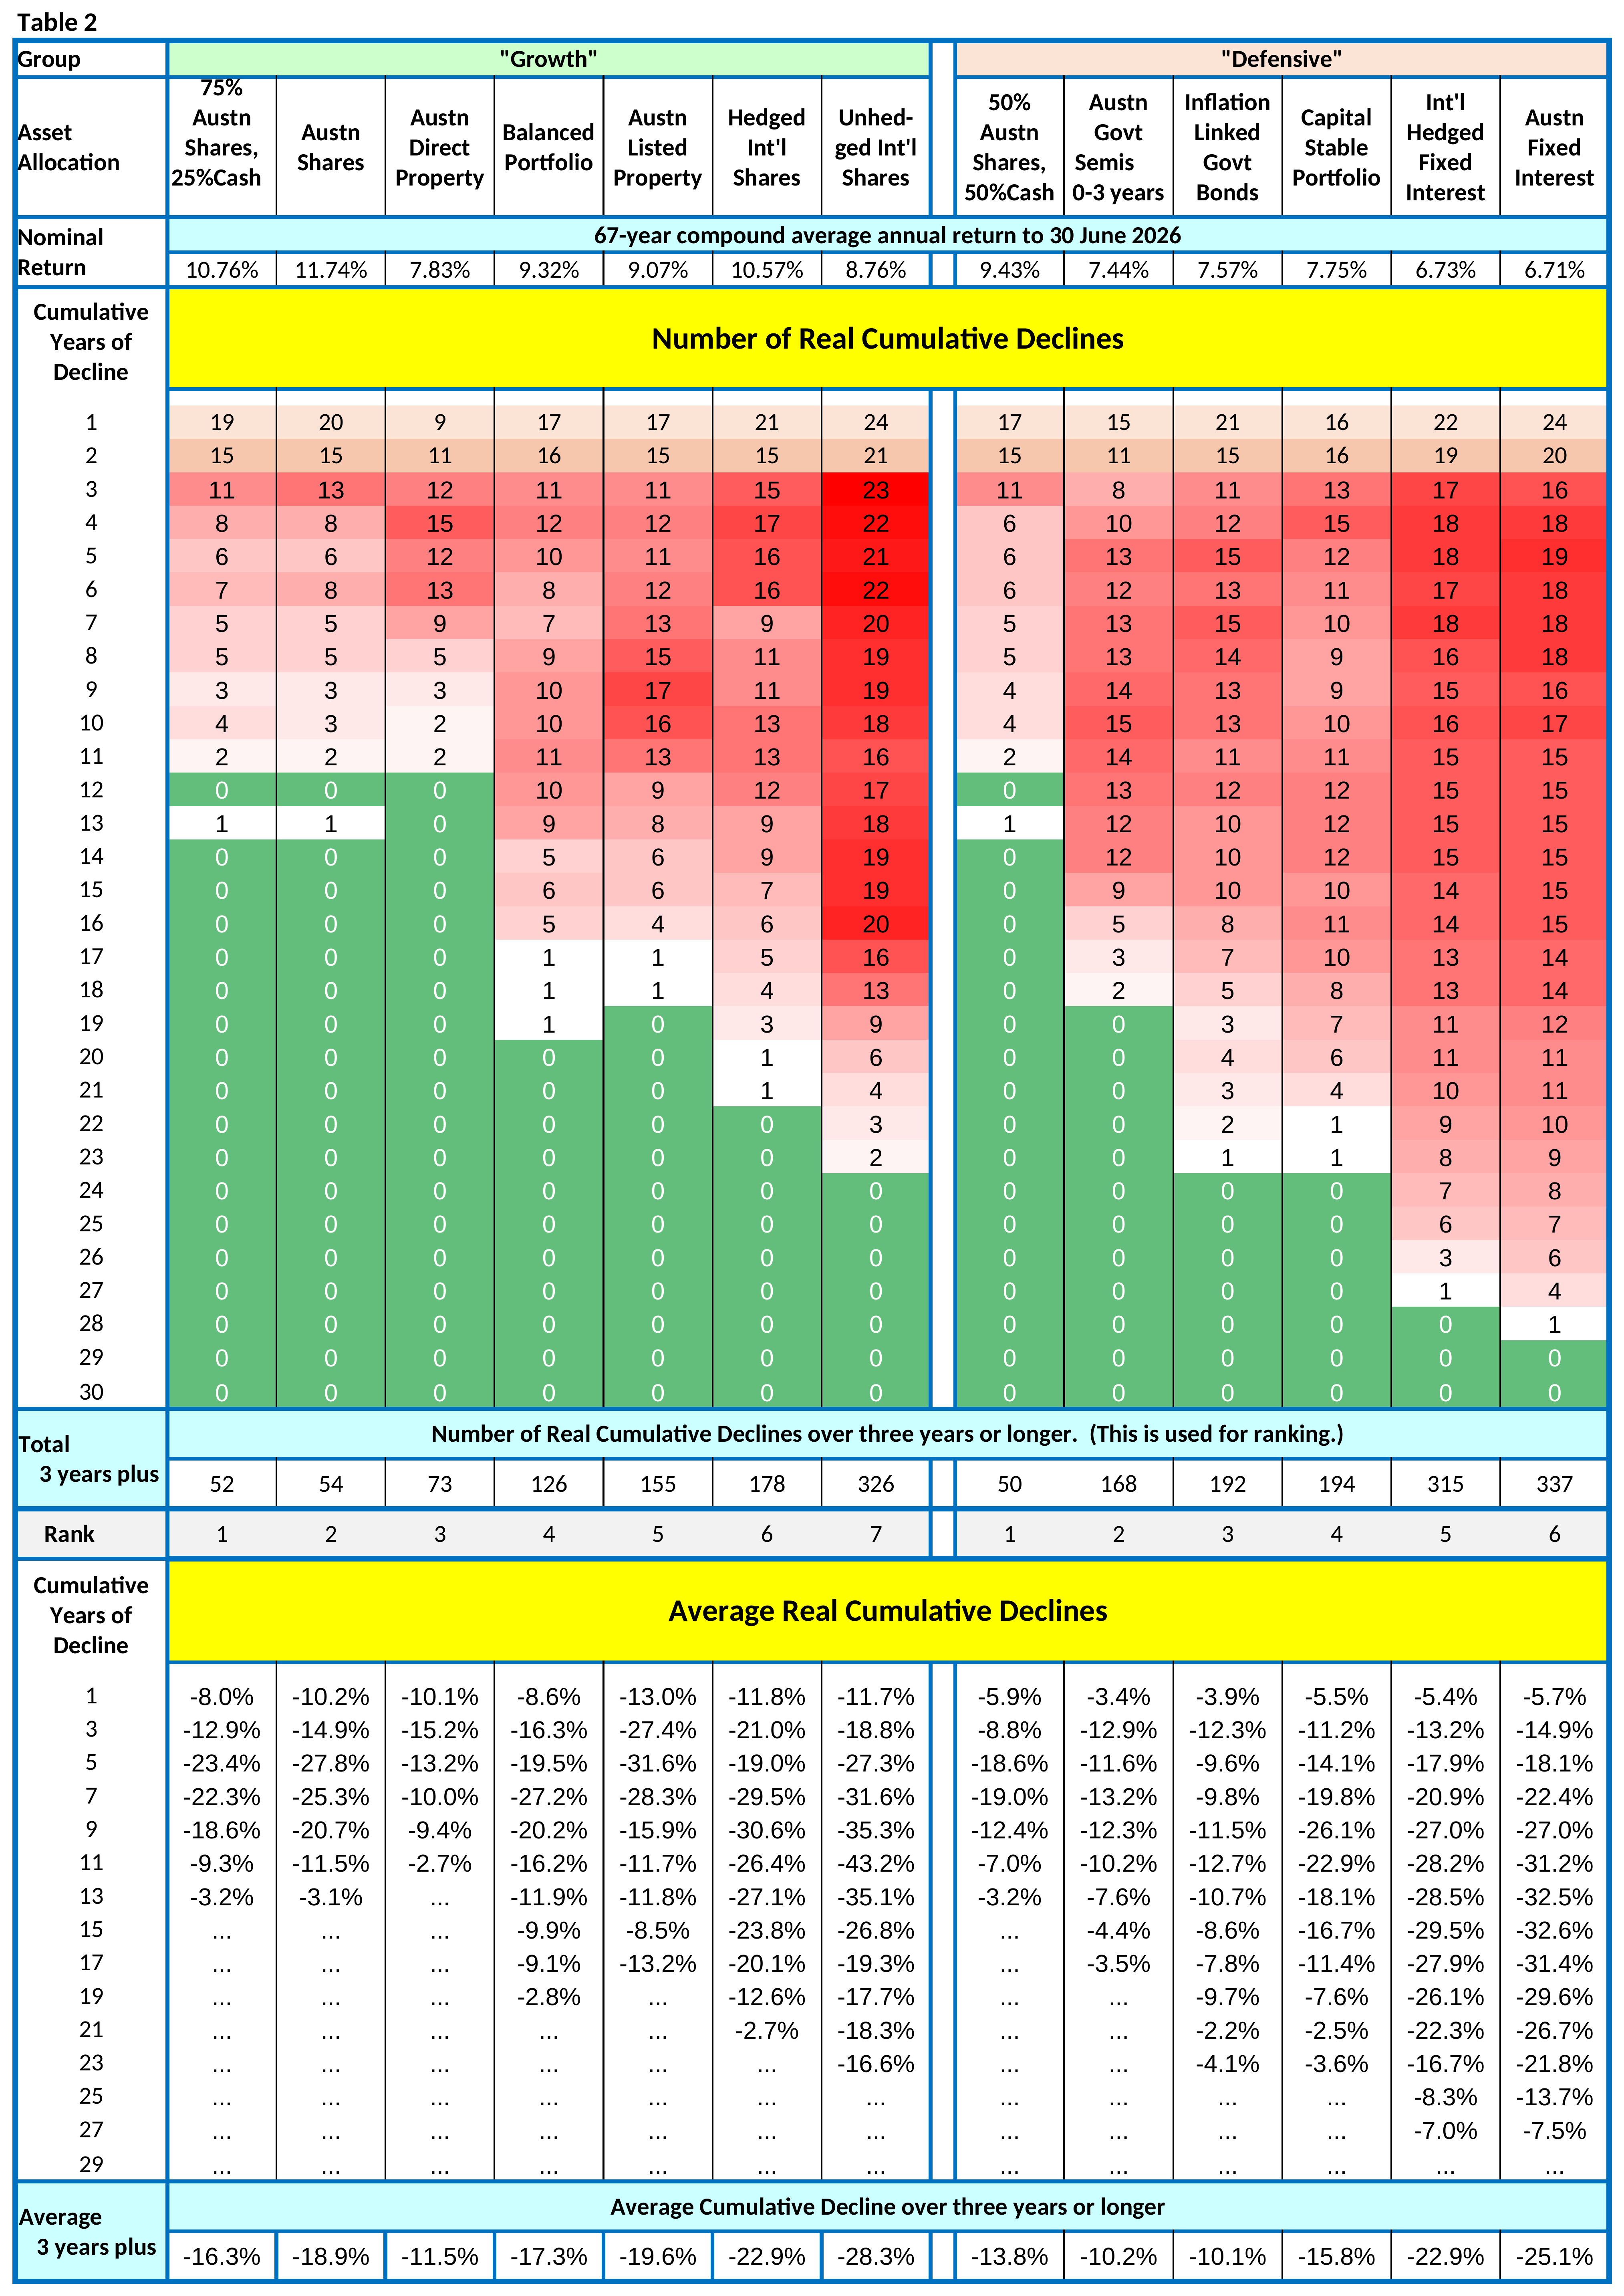
Table 2: Real Sequencing Risk
Again, a retiree or annuitant who is highly averse to sequencing risk might wish to recognise declines earlier than three years. However, with real declines, this does not affect the rankings of any of the "Growth" asset allocations, and for "Defensive" the ranking for Capital Stable improves to only marginally better than Inflation-linked Government bonds.
Both Tables 1 and 2 illustrate the advantages (higher investment returns and lower sequencing risk) that are possible from investment asset allocations based on mixtures of Australian Shares and Cash.
Both tables also show the dangers (very high sequencing risk) that retirees and annuitants might face from investing in Unhedged International Shares - primarily because of long-term currency cycles.
For those seeking inflation-protected incomes, Table 2 also illustrates the dangers (high real sequencing risk) that may arise from investing in Fixed Interest asset allocations (for both Australian and Hedged International variants).
For those seeking inflation-protected incomes, Table 2 highlights the high real sequencing risk of Fixed Interest allocations — the risk that returns will not keep pace with inflation.
It seems clear from the results that the impact of price inflation on sequencing risk is important and can influence optimal asset allocation decisions. As probably expected, the impact of price inflation has a very adverse effect on "Defensive" assets. Whether decumulation asset allocation decisions should be based on nominal or real sequencing risk will depend on whether a retiree’s personal objectives are, for example, based on:
The author would like to thank Cary Helenius and Tain Corless who peer-reviewed and assisted with this article.
The views expressed in this article are those of the author(s) or working group named below, and do not necessarily reflect the views of the Actuaries Institute. This work is licensed under a Creative Commons Attribution-NonCommercial-No Derivatives CC BY-NC-ND Version 4.0.

From superannuation policy to retirement income strategy, explore our latest analysis on the system Australians rely on
Subscribe to Actuaries Digital for free and receive the latest actuarial analysis, research, and commentary direct to your inbox