Life Insurance
General Insurance
Bridging the divide between financial reporting and regulatory capital




Claim your CPD points
IFRS 17 is a financial reporting standard that governs how insurance contracts are recognised, measured, presented and disclosed, enabling investors and other users to assess an insurer’s current financial position and performance. Solvency II is Europe’s prudential regulatory framework designed primarily to protect policyholders by assessing insurers’ risks, governance and capital adequacy.
Companies have to be aware of the key differences between the two frameworks in order to avoid costly pitfalls.
The grouping of insurance contracts in IFRS 17 aims to limit potential cross-subsidies.
First, portfolios are defined by the way they are managed (allowing a better attribution of expenses).
However, the grouping in Solvency II is entirely driven by risks and the corresponding sensitivities (e.g. lapse up, lapse down, etc.).
Cash flow projections
Let us first look at the expected insurance cash flows in IFRS 17. Given that we are determining a liability, outflows have a positive sign as they increase the liability, whereas inflows reduce it. So, for all future years, we project the negative inflows (the premiums), reduced by the positive outflows (the claims and expenses) based on current assumptions.
We have seen the granular grouping in IFRS 17 and can now ask how far these groups have to be reflected in the assumption setting. Regarding experience data, the granular groups are far too small for any reliable analysis. So in practice, the assumptions for many groups (as well as the ones for IFRS 17 and Solvency II) will be the same.
However, the projection of expenses in IFRS 17 and in Solvency II is fundamentally different:
Discounting
A sum of money currently available has a greater value than the same sum to be paid in the future because of its earnings potential in the interim. This so-called time value of money is a core principle of finance and is reflected in the discounting of both frameworks.
IFRS 17 allows two methods to derive the current discount rates:
The default discounting in Solvency II is based on risk-free rates published by the European regulator on a monthly basis [1] . There are two additional discounting options:
Analysing the annual reports of various insurance companies, we observed that the liquidity premiums applied in IFRS 17 are significantly higher than the Volatility Adjustment [2] . As a consequence, the IFRS 17 liabilities are in general lower than the ones in Solvency II; in particular in the case of long-term contracts.
Risk Adjustment vs Risk Margin
IFRS 17 and Solvency II both require an explicit allowance for risk. The basis for the IFRS 17 liability is the discounted cash flows. On top of that, the Risk Adjustment is added to allow for the uncertainty of the amounts and the timing of the cash flows. Similarly, the economic balance sheet in Solvency II contains a risk margin on top of the best estimate liabilities. This covers the cost of capital based on all future solvency capital requirements (excluding hedgeable market risks).
There is a wide variety of calculation methods which are all in line with the high-level principles stated in IFRS 17: [3]
The following graph shows the different methods insurance groups use in practice [4]
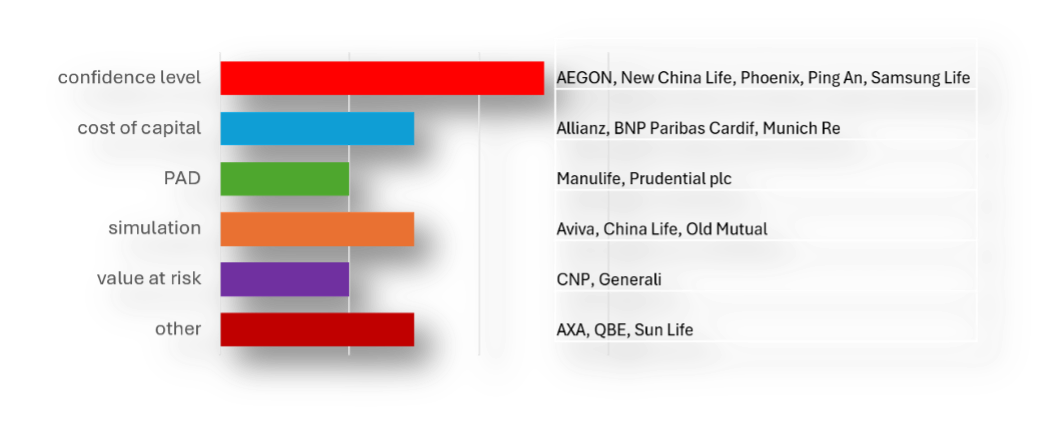
Different methods insurance groups use in practice.
Given the wide variety of methods and calibration, risk margin and risk adjustment can differ significantly (in general, the Solvency II risk margin is higher).
Closing message to readers
The challenge is not simply to reconcile two sets of numbers, but to understand what each framework is designed to communicate — and to ensure that management, regulators and investors interpret those numbers correctly.
[1] https://www.eiopa.europa.eu/tools-and-data/risk-free-interest-rate-term-structures_en
[2] Michael Winkler, Sunil Kansal: “IFRS 17—How Discounting Shapes Financial Outcomes”, Contingencies March/April 2026
[3] Sunil Kansal, Michael Winkler: “ Navigating IFRS 17: A Practical Guide to Accounting & Actuarial Implementation », 2025; Spanish edition: “Implementación de la NIIF 17”
[4] Sunil Kansal, Michael Winkler: "Easier Said Than Done: Challenges Reading IFRS 17 Statements”, July 2024
The views expressed in this article are those of the author(s) or working group named below, and do not necessarily reflect the views of the Actuaries Institute. This work is licensed under a Creative Commons Attribution-NonCommercial-No Derivatives CC BY-NC-ND Version 4.0.


Explore actuarial thinking on life insurance pricing, product design, regulation and the evolving risk landscape
Subscribe to Actuaries Digital for free and receive the latest actuarial analysis, research, and commentary direct to your inbox