Health
The optics of private health insurance single parent premium rates



Claim your CPD points
The question asked is why single parents pay substantially more to cover their children compared to two-adult families.
This article explores the current state of this issue by comparing the relative premium rates between Single Parent (SP) and Single (S) policies, and between Family (F) and Couple (C) policies. It is important to note that we are only measuring the differences in premium rates and not cost relativities.
It is important to note that just because premium rates are higher does not make the product unfair and highlights the importance of further studies using claims data, which is the crucial missing piece of information. Nevertheless, we hypothesise potential reasons for and against the current state.
Although to a policyholder, it is the dollar difference in their premiums that matter, for a product-standardised comparison, we measure the relative premium rates of Single Parent versus Single, and Family versus Couple, expressed in terms of the Single price, because this represents the marginal price of adding children to adult-only covers [1] .
National industry relatives
The table below summarises the industry relativities by scale in Australia for open and non-corporate products. The industry averages are simple averages of the premium rates of products in the market i.e., not revenue or exposure weighted, due to data limitations of privatehealth.gov.au data. Furthermore, to improve the consistency of the comparison we have excluded non-student dependent or disability versions of a product where there are multiple versions. The calculation methodology is further explained in the appendix below.
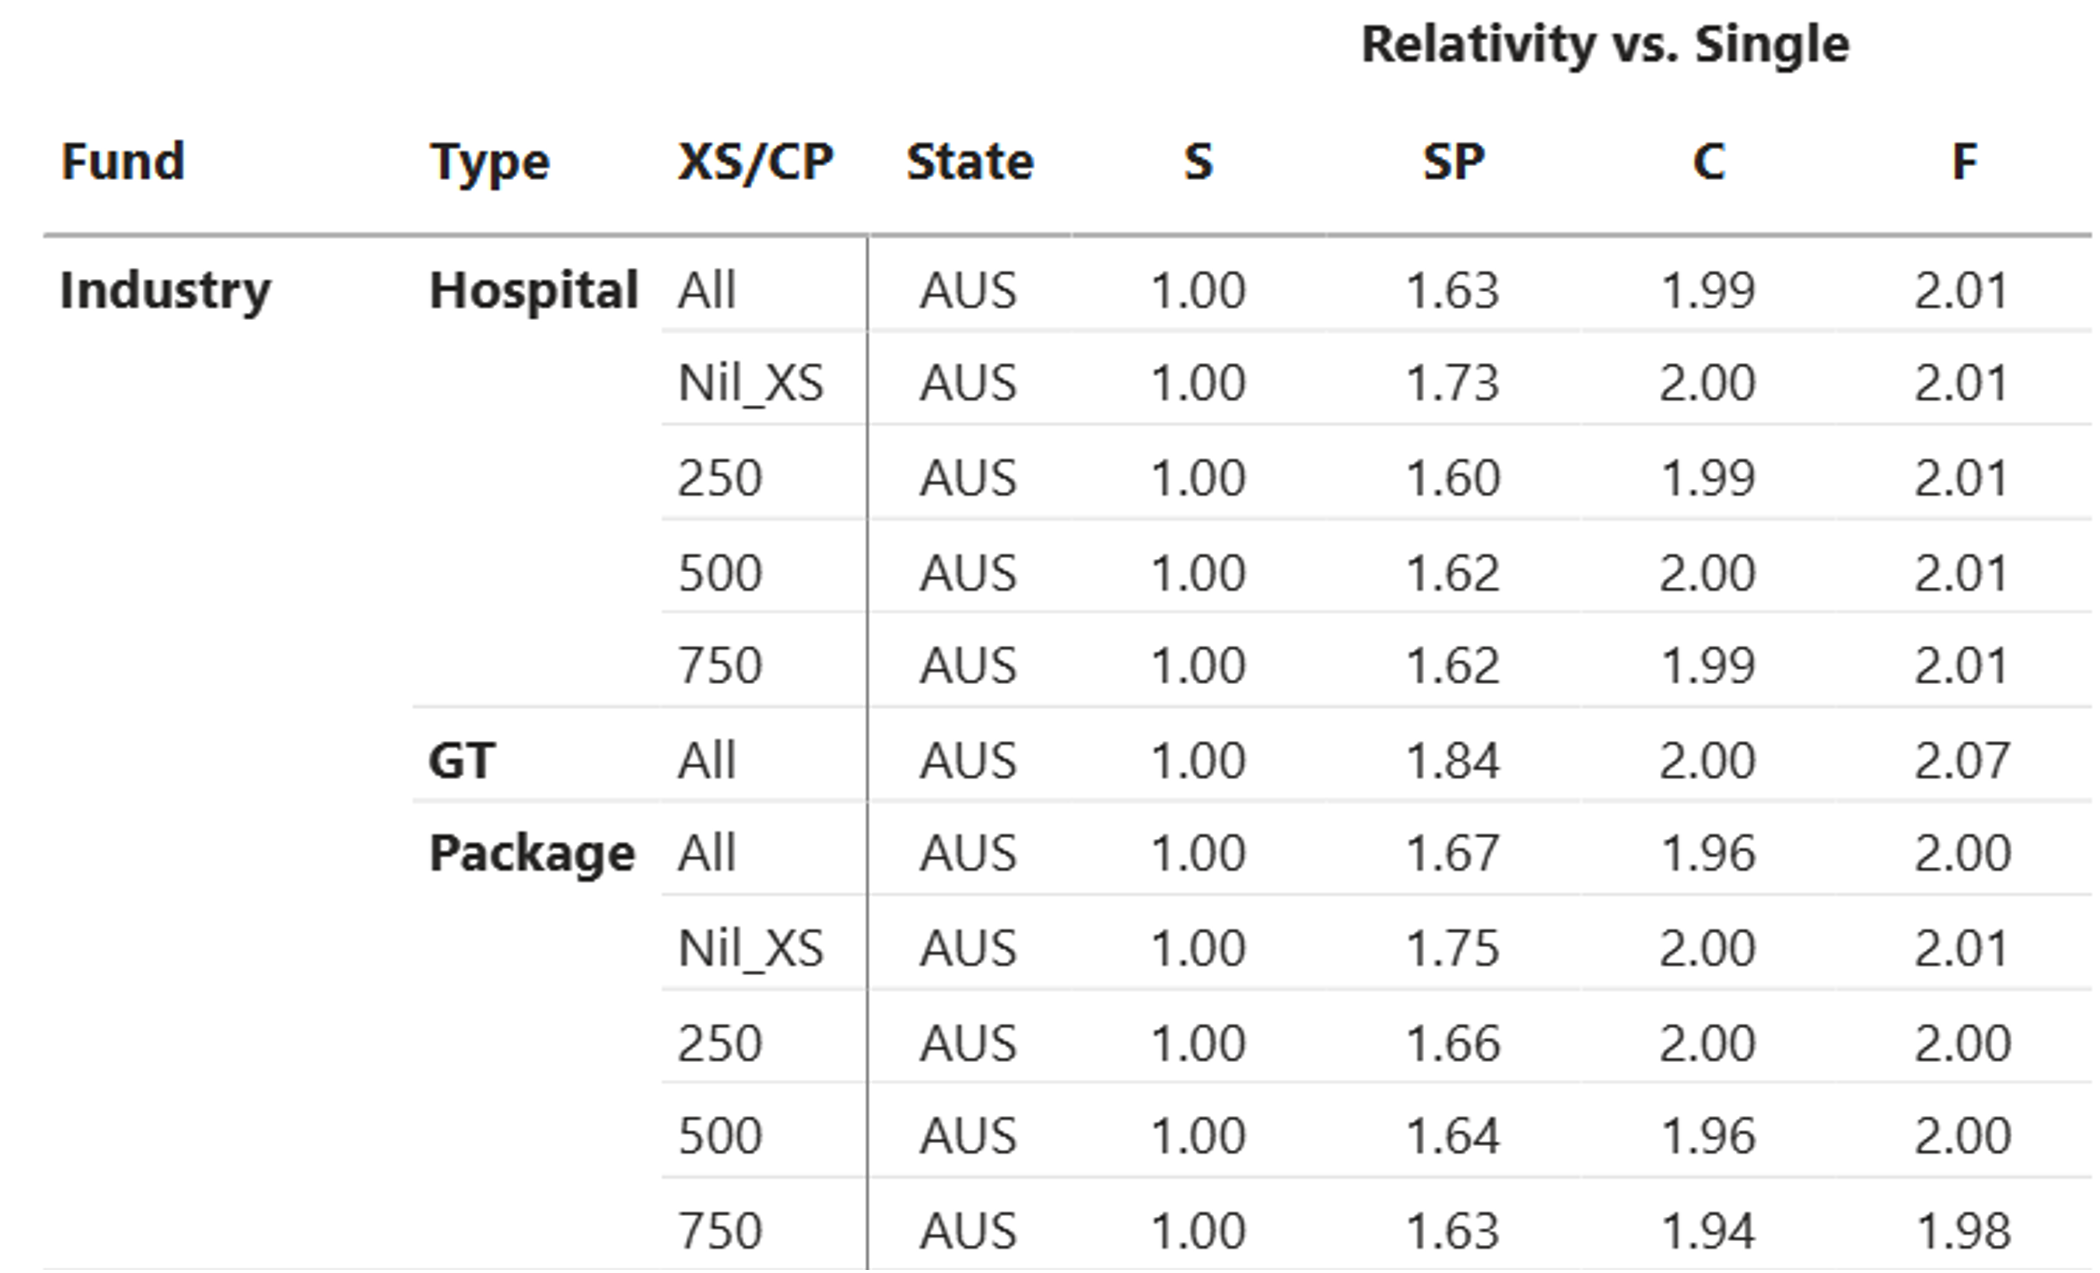
Table 1: Industry Premium Relativities by Scale
Source: Australia, all funds, open non-corporate products, August 2026 privatehealth.gov.au data.
When interpreting these figures, the relative premium rates of Single Parent versus Single, and Family versus Couple, expressed in terms of the Single price are compared, because this represents the marginal price of adding children to adult-only covers.
From an optics perspective, the relativities appear to support DOHDA’s comments on fairness. On average, Single Parent policies pay a premium of 63% and 84% to cover their children for Hospital and General Treatment (GT), respectively, compared with Families, who pay 1% to 7% above the Couple price. Furthermore, Single Parent hospital policies face an even greater margin for choosing the nil excess option (73%), an additional margin not incurred by Families, noting that there are few funds offering nil excess hospital, and so some volatility is to be expected.
The GT marginal cost is higher than hospital, which is generally to be expected because children are more likely to claim under GT compared to hospital, however; this cost for Single Parents is significantly higher than for Families.
Relativities by state
At an industry average level, there does not appear to be material variation by state.

Table 2: Industry Single Parent Premiums Rates Relative to Single
Source: All funds, open non-corporate products, August 2026 privatehealth.gov.au data
Relativities by fund size
This section explores the variance by fund. The chart below plots the Single Parent relativities by fund and by product type. Each dot represents a fund.
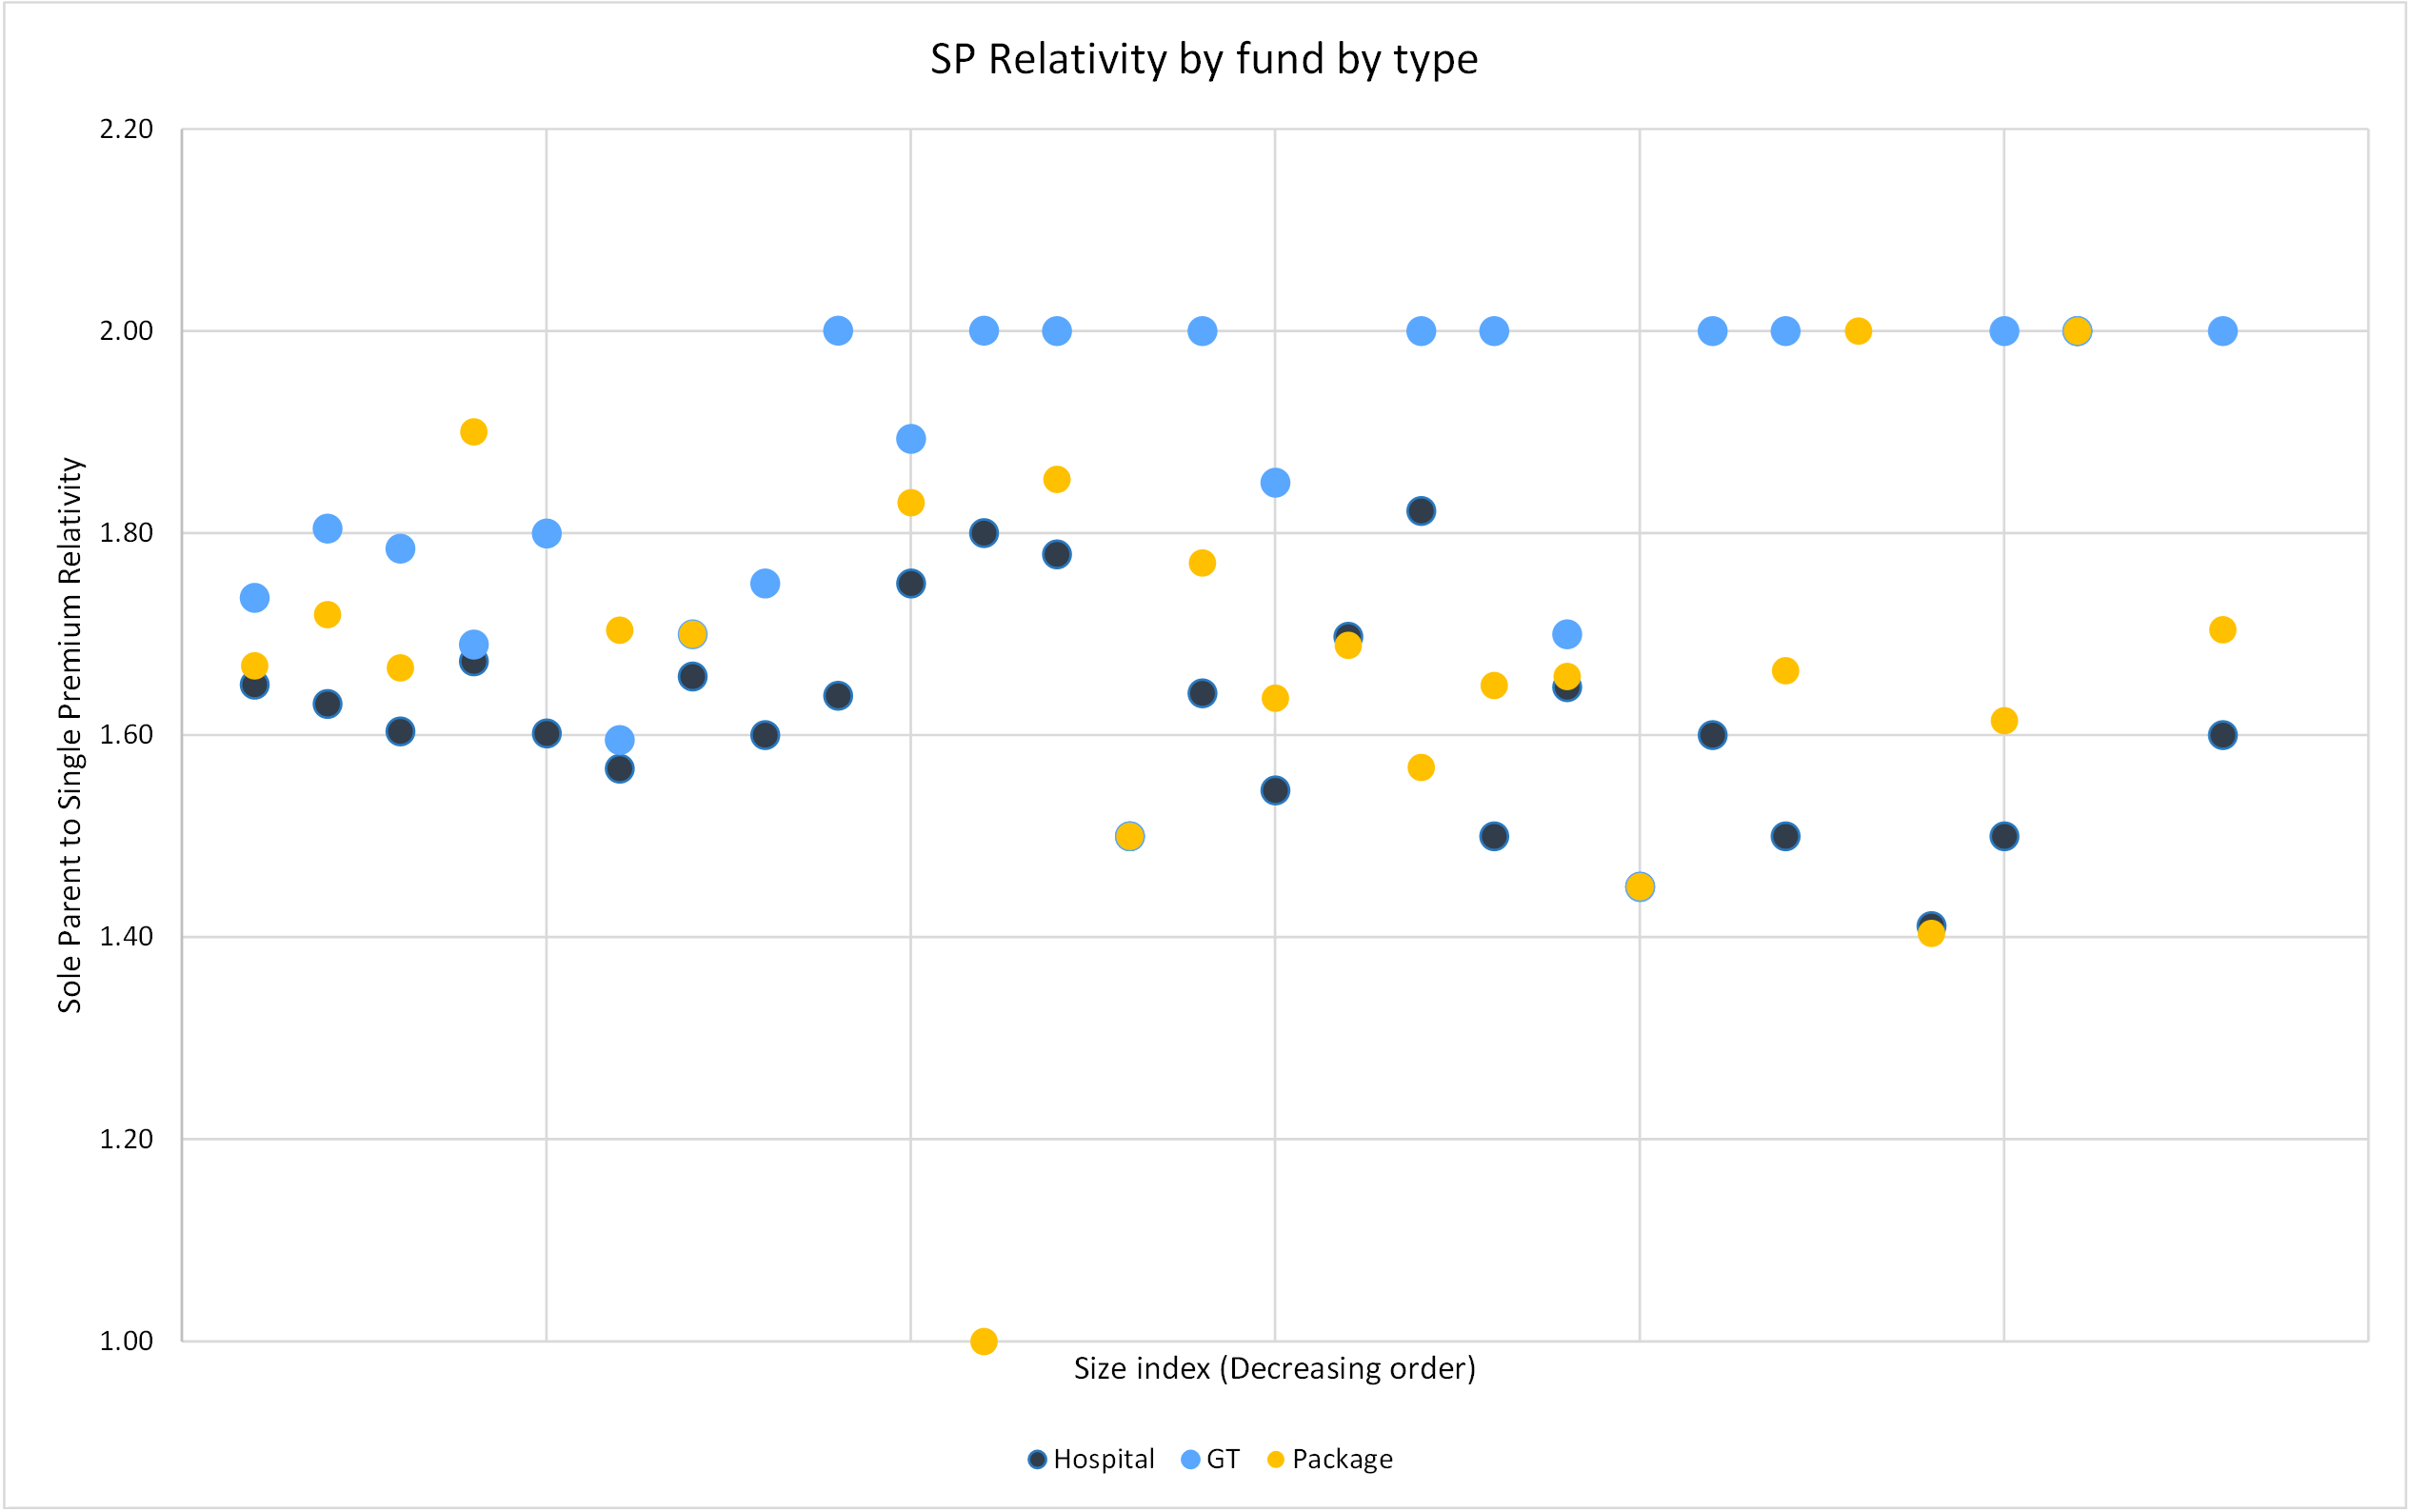
Figure 1: Single Parent premium rate relativities by type by size (relative to Single)
Source: Australia, all funds, open non-corporate products, August 2026 privatehealth.gov.au data
Key observations include:
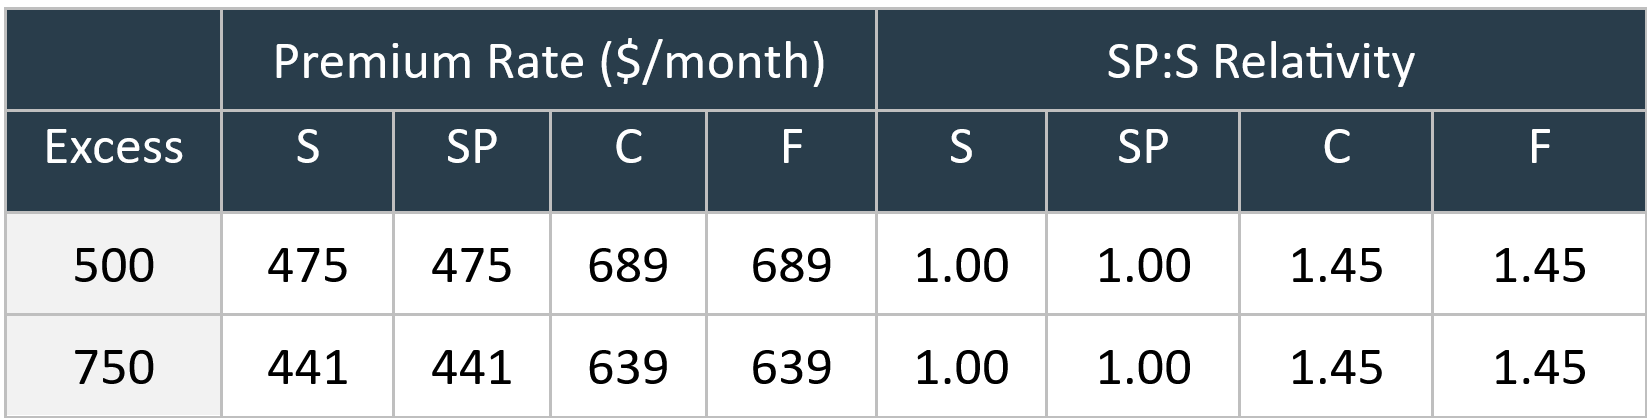
Only one fund did not apply a Single Parent relativity to all its products, and that is Westfund’s packages, as illustrated below.
SIS Links
Table 3: Case Study of Westfund Silver+ Hospital, NSW Single Parent to Single Premium Relativity, August 2026
Note: Premium rates exclude loadings/rebates
From an optics perspective, there is potential for the fairness of Single Parent pricing to be questioned by the consumer. In the absence of publicly available claims data, the following explores potential reasons for the observed relativities.
Claiming rates
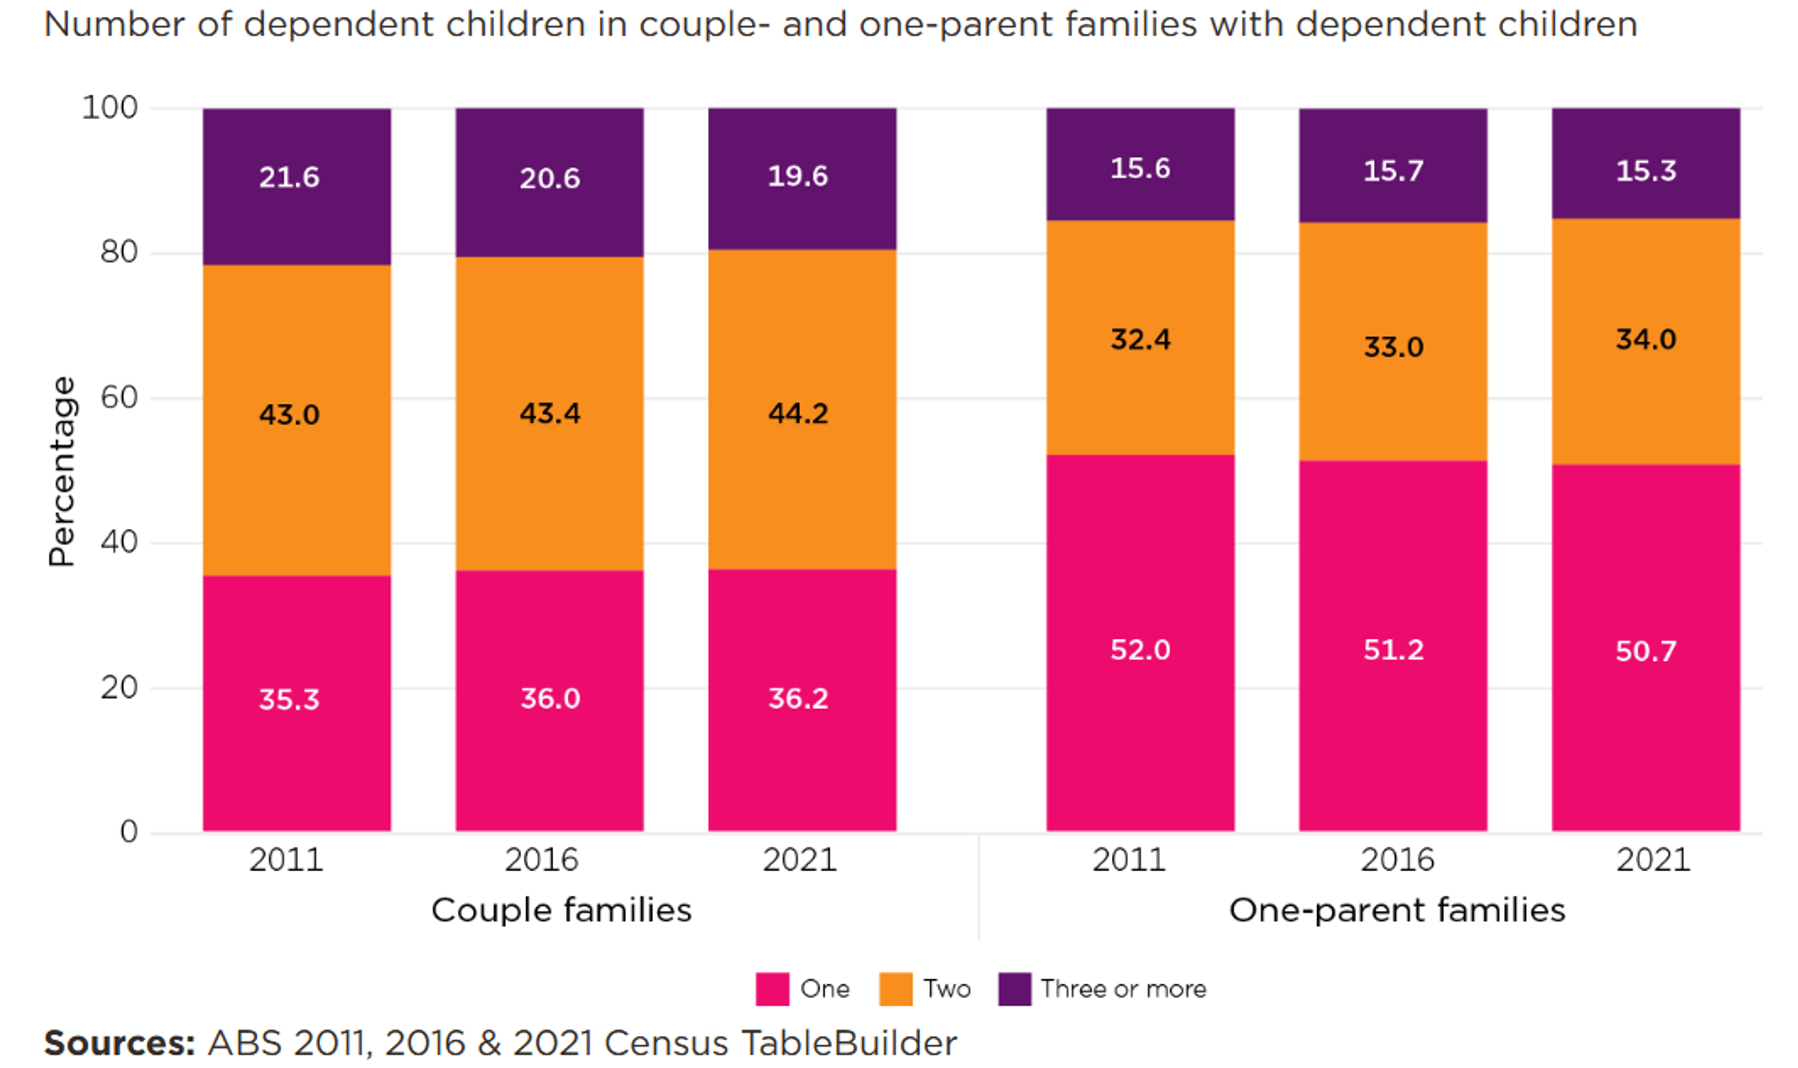
Figure 2: The number of dependent children by family type
Source: https://aifs.gov.au/all-research/facts-and-figures/families-and-family-composition
Historical practices and cross-subsidisation
It may be that the Single Parent pricing has been anchored based on historical pricing practices where due to its lower materiality [3] , its pricing was simply an assumed multiple of Singles carried forward.
The relativities may also reflect deliberate cross-subsidisation strategies, and although it is unlikely that all funds adopt the same strategy, herding could occur as smaller funds follow the relativities adopted by larger ones.
Risk Equalisation
The current Risk Equalisation scheme was introduced in 2007. Since inception, Single Parent and Single policies are treated equally when determining the amount per policy that funds need to contribute to the pool (Calculated Deficit), as well as recoveries from the pool (Gross Deficit and the High Cost Claims Pool). Therefore, for a given policyholder, the current risk equalisation system does not impose greater costs on Single Parent policies relative to Single policies and is not a reason for the Single Parent relativity.
Next steps
A potential concern for funds is that reducing the Single Parent price could create incentives for some two parent families to restructure their cover, where one adult purchases the higher cover for themselves and their children, while the other adult downgrades to a basic cover or ceases PHI coverage altogether. This is a key concern for the industry because it will result in lower industry premiums and higher premium rates for all remaining policyholders. Reform, therefore, should balance this potential effect against the community benefits of lower Single Parent rates.
Nevertheless, there appears to be opportunities for improvement:
The calculations are performed under the following conditions.
[1] This differs from Choice’s methodology, which measures the relativities of Family and Single Parent rates against the Couple and Single rates respectively. We believe that standardisation relative to the Single rate allows for a more like-for-like comparison since the Couple rates are typically double that of the Single rates. This metric is also different to the premium per policy relativities between each scale (e.g. from the APRA statistics), because the latter does not standardise for the product mixes within each scale.
[2] Australia Prudential Regulatory Authority
[3] June 2025 policy mix of 3.9% for hospital and 5.7% for GT, APRA Statistics
The views expressed in this article are those of the author(s) or working group named below, and do not necessarily reflect the views of the Actuaries Institute. This work is licensed under a Creative Commons Attribution-NonCommercial-No Derivatives CC BY-NC-ND Version 4.0.

From risk equalisation to claims analytics, explore actuarial perspectives on Australia's health insurance sector.
Subscribe to Actuaries Digital for free and receive the latest actuarial analysis, research, and commentary direct to your inbox