Australian Actuaries Climate Index
The Australian Actuaries Climate Index (AACI) measures how the frequency of extreme weather conditions and sea level in Australia is changing over time.

About
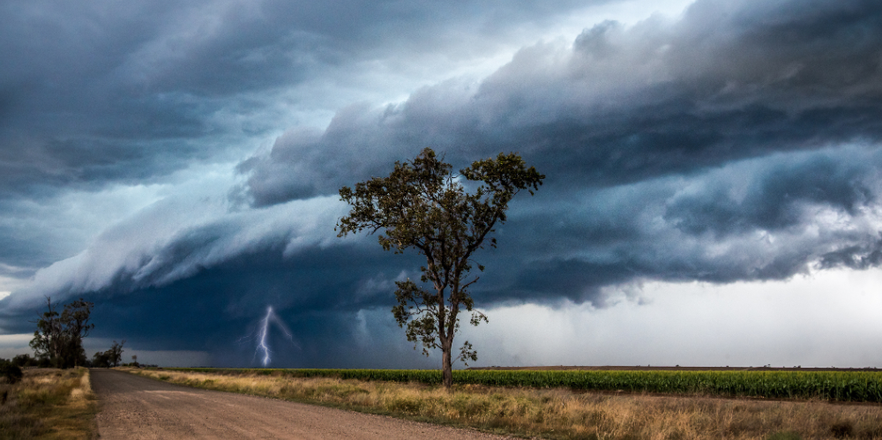
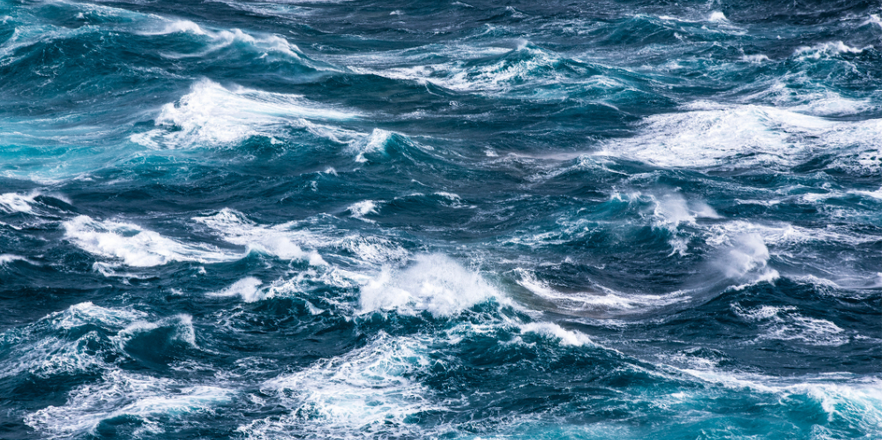
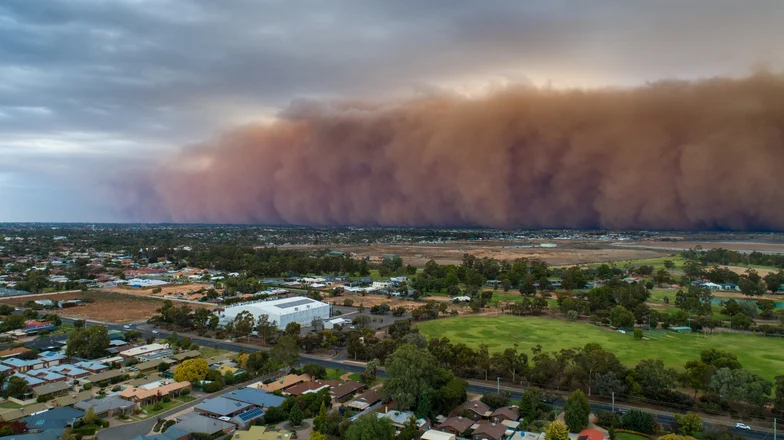
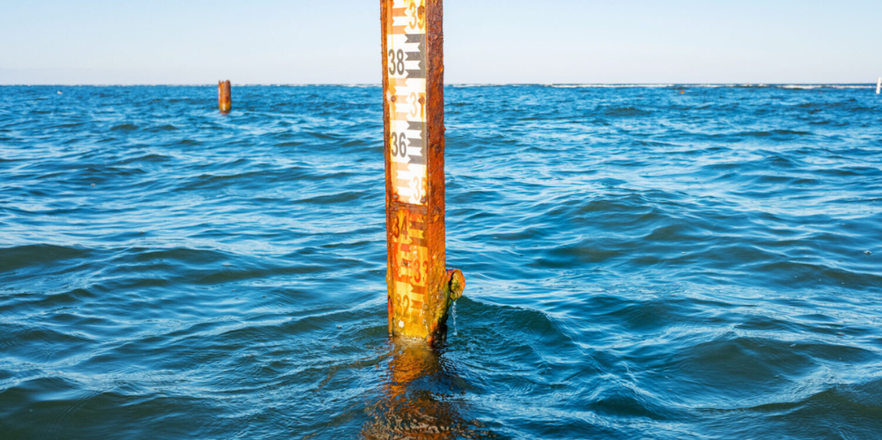
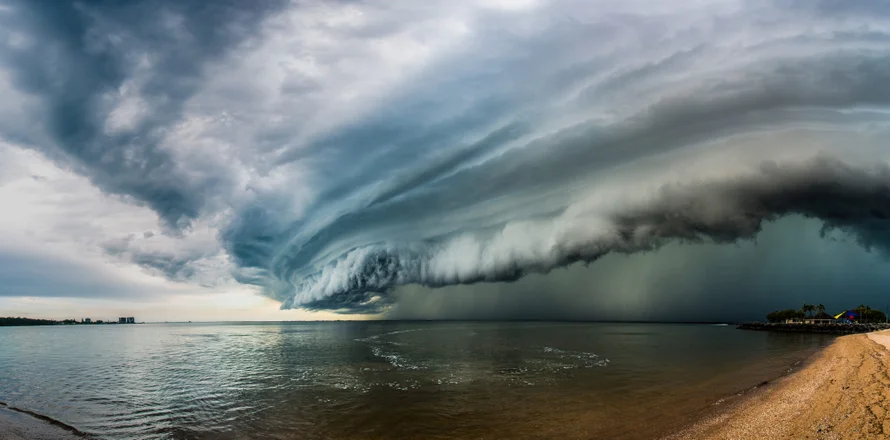
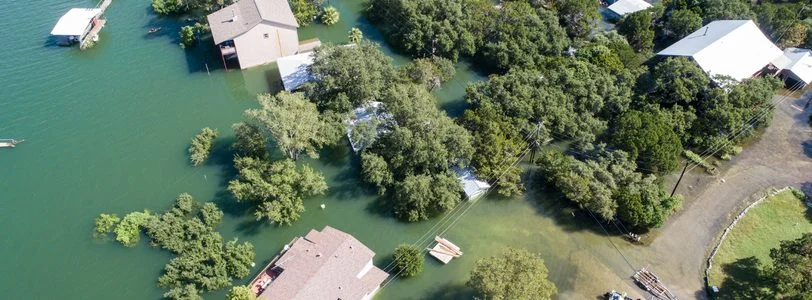
It covers extreme high and low temperatures, extreme rainfall, consecutive dry days, extreme wind and sea level. Unlike many other measures, the Index focuses on changes in the extremes. This is a more relevant metric for the insurance industry than averages, as it correlates more closely with damage. This is done by measuring how often we observe exceedances of an extreme threshold, usually the 99th percentile, set during the reference period of 1981-2010.
The AACI is designed to provide an easy to interpret and valuable metric for actuaries, policy decision-makers and the general public to refer to when monitoring changes in climate.
It includes a series of component indices and a composite index.
► The component indices show changes in the frequency of extreme levels of each of temperature (high and low), rainfall, consecutive dry days, wind and sea level.
► The composite index, the AACI, combines the measures of high temperature, rainfall, wind and sea level into a single index.
Many of the organisations that actuaries support are concerned with climate risk and with how it will affect their operations – for example, local and state governments, general, life and health insurers, banks and investment managers. The Index is intended to provide a useful measure of how the extremes of weather are changing in order to support assessment of the change in risk.
The Index and components examine how the frequency of extreme weather has changed compared against a reference period of 1981-2010.
The Index, and components, are available for 19 regions of Australia. Results are produced for each season such that, for example, autumn is compared to previous autumns.
The underlying data is derived from the ERA-5 and ORAS5 reanalysis datasets from the European Centre for Medium-Range Weather Forecasts (ECMWF) as part of the Copernicus Climate Change Service (C3S).
Positive exceedances indicate the frequency of extreme weather and sea levels has increased compared with what was observed during the reference period. Negative exceedances indicate the frequency of extremes has reduced compared with what was observed during the reference period.
The Index was launched in 2018 and v2.0 was published in 2025. Download the AACI Design Documentation.
The Institute commissioned Finity Consulting to compile the Index ahead of its launch and the v2 update, and they remain commissioned to provide the quarterly updates.
The Actuaries Climate Index™ (ACI) developed in North America and maintained since November 2016, serves a similar purpose to the AACI.
The Indexes cannot be directly compared due to different underlying components and exceedance thresholds.
Sample calculations and comments on the extremes of the Australian Actuaries Climate Index at particular geographic locations in Australia can be found here.
Latest articles


Australian Actuaries Climate Index
Component graphs and data
Explore the Australian Actuaries Climate Index via interactive graphics and downloadable data.

FAQs
AACI Frequency Asked Questions
Explore our FAQs to understand how and why the Index was developed.
Questions? Comments? Want to get involved?
Contact us about the Australian Actuaries Climate Index today. We’d love to hear from you.
