Australian Actuaries Climate Index component graphs and data
Explore interactive graphs which visually represent the Index data. You can also download the raw data.

How to use the component graph and charts
- Filter by Index or component type below
- Select region to highlight index data for that area
Data breakdowns and definitions
Definitions, links, references and terms of use for the Australian Actuaries Climate Index.
There are six individual indices available which have been chosen for the impact and risk they pose to people and the economy. The indices are described in the table below.
| Component | Description |
| High temperature | Monthly frequency of maximum and minimum temperatures above the 99th percentile. |
| Low temperature | Monthly frequency of maximum and minimum temperatures above the 1st percentile. |
| Precipitation | Monthly frequency of 5-day consecutive rainfall above the 99th percentile. |
| Wind | Monthly frequency of daily wind gust above the 99th percentile. |
| Consecutive dry days | Annual maximum consecutive dry days. |
| Sea level | Monthly mean sea surface height. |
Temperature
For the high temperature, the AACI measures the change in the proportion of days in a month on which the maximum and minimum temperatures exceed the 99th percentile of the reference period distribution for the relevant day. The results for the maximum and minimum temperatures are then averaged. The low temperature measure is calculated using a similar process by looking at the frequency above the 1st percentile. Both the high and low temperature components therefore record if there is a warming in temperature.
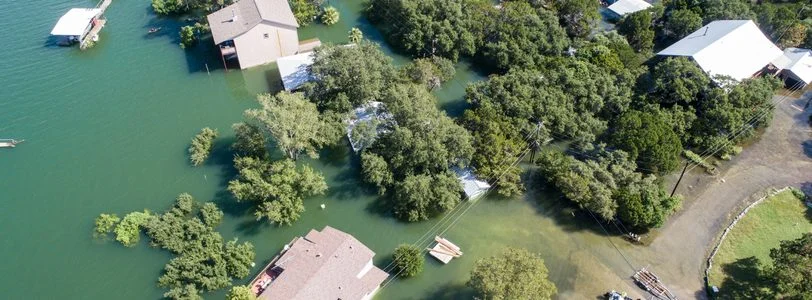
Precipitation
Extreme precipitation over short periods is a key driver of flood and storm damage. The rainfall component of the index focuses on extreme rainfall over a consecutive 5-day window.
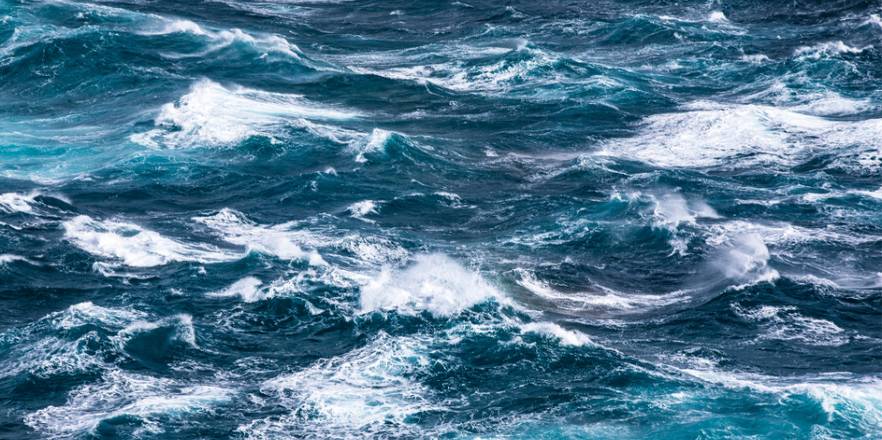
Wind
During severe wind weather events such as storms and cyclones, it is the maximum wind gusts that are likely to lead to higher risk and damage. The wind component measures the monthly frequency of daily maximum wind gust above the 99th percentile.
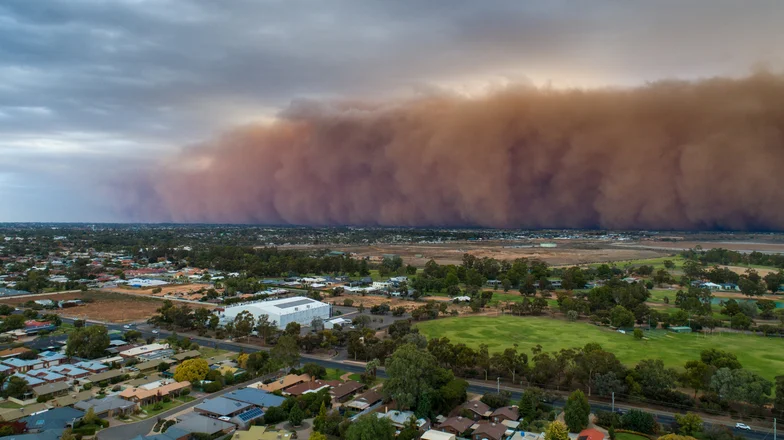
Consecutive dry days
Consecutive dry days is included in the Index as an indication of drought conditions. It is defined as the number of consecutive days with less than 1mm of rain up to a maximum of 365 days. The cap is included for practical purposes and has no material impact on the Index.
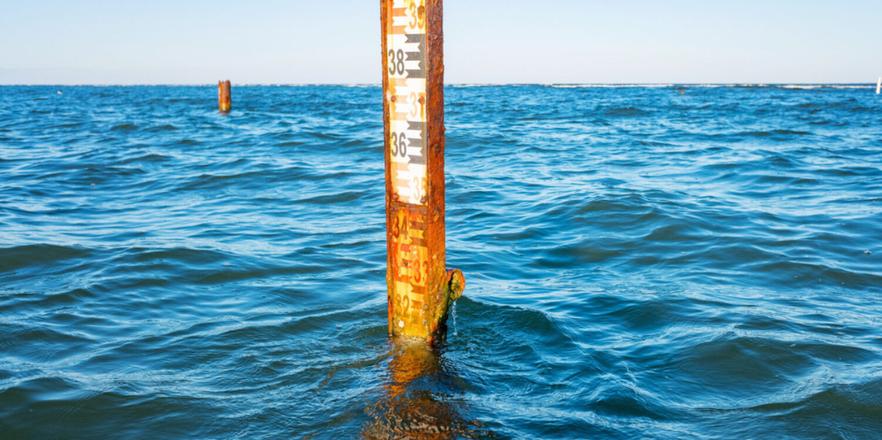
Sea level
The sea level measure tracks movements in the monthly mean observed sea surface height, an important risk factor for coastal inundation.
Further information on component definitions is available in the Design Documentation.
- The Actuaries Climate Index ™ (ACI) has been developed in North America with a similar objective.
- Avoiding Inhomogeneity in Percentile-Based Indices of Temperature Extremes , Zhang et al, (2004)
This Australian Actuaries Climate Index (AACI) website is operated by the Institute of Actuaries of Australia (ABN 69 000 423 656). Access to this website is conditional on acceptance of these terms of use. Use of the website indicates your acceptance of these terms of use.
Disclaimer
- Information provided in the AACI does not necessarily represent those of either the Institute of Actuaries of Australia (the 'Institute'), its members, directors, officers, employees, agents or that of the employers of aforementioned groups.
- The Institute and the employers accept no responsibility, nor liability, for any action taken in respect of the information provided in the AACI.
Gridded data from the Copernicus Climate Data Store was relied on to construct the AACI.
While the reanalysis data from the CDS was reviewed for reasonableness, detailed analysis was not undertaken. Therefore, reliance was placed upon this source to provide accurate and complete data information.
More specifically:
- The land-based components (temperature, rainfall and wind) use 11,154 gridded points at approximately 31 km intervals across Australia.
- The sea-based component (sea level) uses 174 points within 3 kilometres of the coastline.
This is the fifth generation of atmospheric reanalysis produced by the European Centre for Medium-Range Weather Forecasts (ECMWF) as part of the Copernicus Climate Change Service (C3S). It provides a comprehensive, consistent and high-resolution record of global atmospheric, land surface and ocean wave variables from 1950 to the present.
ORAS5 (Ocean Reanalysis System 5) is the ocean component of the ECMWF reanalysis system , based on the OCEAN5 ocean-sea ice reanalysis framework. It provides a physically consistent reconstruction of historical ocean conditions, including sea surface height, temperature, salinity and currents, by assimilating ocean observations into an ocean-only model.
For more information on the data and the development of the AACI, see Design Documentation.
Region definitions
Results are available for Australia and for 19 climatologically consistent regions of Australia as shown below. These regions are based on the administrative National Resource Management regions, although regions have been grouped. In addition, modifications were made to Northern Territory, Western Australia and Queensland to better distinguish between coastal and inland areas.

Map showing the 19 climatologically consistent regions of Australia
Latest AACI articles


Questions? Comments? Want to get involved?
Contact us about the Australian Actuaries Climate Index today. We’d love to hear from you.
